Hi all,
I would like to set up the following two screen rules:
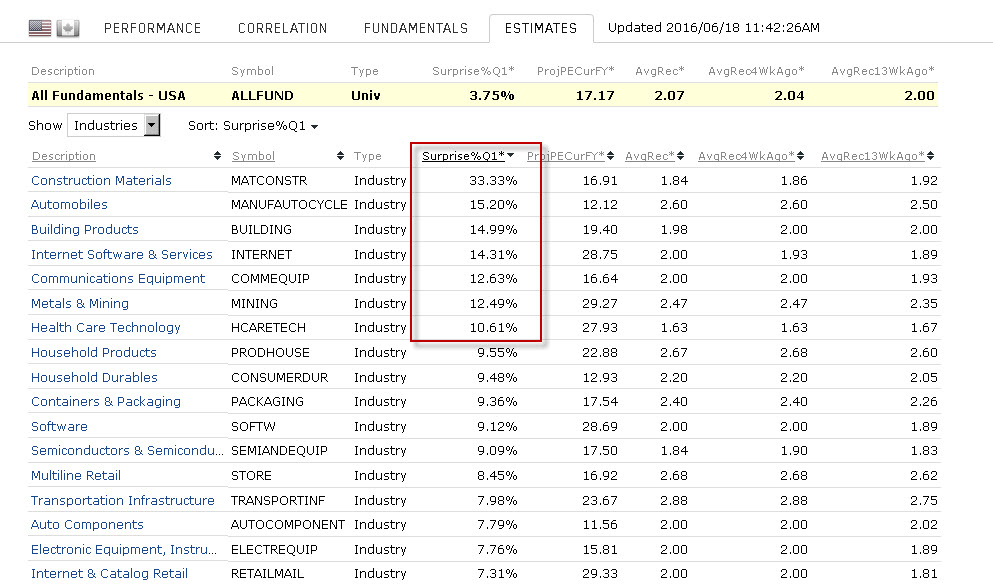
- screen for industry whose Surprise%Q1 is larger than 10% (see red rectangle in attached screen capture; this is equivalent to the top 10% rank (7 out of the 70 industry groups)).
- screen for stocks which have a higher Surprise%Q1 than the industry average (for attached example, a health care technology stock would need to have surprise%Q1 larger than 10.61%).
I have the following setup:
SetVar(@indsurp,FMedian(“Surprise%Q1”,#Industry)) //calculates the median surprise as per table below
SetVar(@indrank,FRank(“@indsurp” , #Industry, #DESC)) //sort by higher is better
@indrank>90
Surprise%Q1 > FMedian(“Surprise%Q1”,#Industry) //fulfills rule 2
The problem I have is that when I do the FRank, all indrank values become 100, instead of being ranked from 100-0. Any idea what I am doing wrong?
Br,
Florian
Hi Florian,
I think there are two problem here.
SetVar(@indrank,FRank("@indsurp" , #Industry, #DESC))
FRank is being passed a constant as a formula. The constant may be differ for each industry but it’s still a constant. With a “formula” that does change with each iteration within FRank, identical ranks are returned. Try passing some literal constants as an exercise.
The other issue is that FRank ranks stock entities and not industries. The #Industry scope parameter just restricts the ranking cohort to a specific industry. The only way I know of to rank industries against each other is within the ranking system. But even there the choice of factors is limited and predetermined.
Hope someone shows me that I’m wrong, since I want to do what you described.
Best,
Walter
Sister - the simple version using the approximation in your description is:
Surprise%Q1>FMedian(“Surprise%Q1”,#Industry)
FMedian(“Surprise%Q1”>10,#Industry)
Steve
Thanks Steve,
Your solution works, it just requires to move the second quote in the second formula:
FMedian(“Surprise%Q1>10”,#Industry)
Cheers,
Florian