I setoff trying these scores myself, and almost figured it out, but hit a brick wall on short interest! What could you use in a P123 screener for this, or is there a suitable replacement for sentiment?
If the unemployment rate is above its value 3 months earlier, then a=1; else a=0. … Close(0,#UNEMP) > Close(3,#UNEMP)
If S&P 500’s EPS estimate is below its value 3 months earlier, then b=1; else b=0. … Close(0,#SPEPSNY) > Close(3,#SPEPSNY)
If S&P 500’s 50-day sma is below the 200-day sma, then c=1; else c=0. … SMA(50,0,#BENCH) > SMA(200,0,#BENCH)
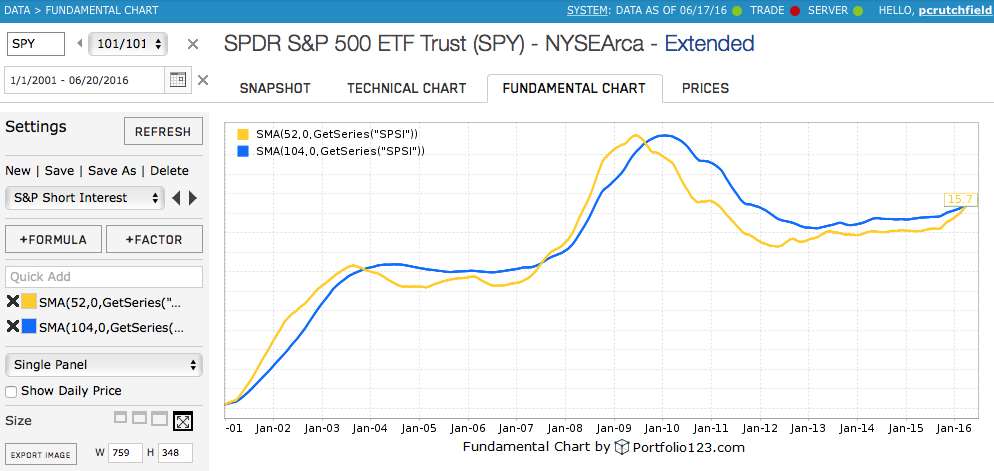
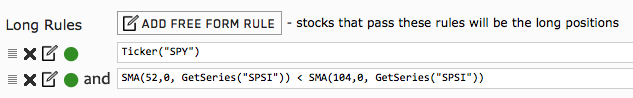
If the 52-week sma of the average short interest in S&P 500 stocks is above the 104-week sma, then d=1; else d=0. … ??? SICM>SIPM3
I can understand the desire to replicate what Piard did. Note, though, the tone of the article. He seems reserved in terms of the significance he ascribes to it and says he’s continuing to work on it.
To me, the most interesting custom series is the way he used economic data to stretch beyond the usual SPEPS items and market movements. There’s much yet to be discovered in terms of risk measurement and market timing. What he did is logical. A lesser EPS estimate trend accompanied by an external indicator of economic weakness is different from a trend slowdown that is not so accompanied.
Hopefully, Piard’s article motivates users to learn and experiment with the broader sets of capabilities we’ve added in recent years.
Thank you all for the assistance - I was able to recreate this, not exactly but close enough to understand the mechanics. This was a very educational exercise indeed!
quick question: I find this indicator very intriguing and want to play with it myself. How have you programmed it in your models?
Being new to P123 I am not so familiar with all of its syntax yet. So I set out to create a custom formula like this:
I then go and e.g. use an entry rule like $MTS4 <= 2. For some reason I dont get any valid signals though. Why is this? And what would be the right way to implement it?
Yes, I saw this. The FRED unemployment rate data is only available for macro charts at the moment. I did about 20 spot checks on the compustat series and found that #UNEMP was point-in-time. The unemployment rate is never revised, so the data never changes.
Andreas,
You have the custom series almost correct. The unemployment rate is monthly, you are checking 13 months back.
Also you must specify the ETFs to select when $MTS4 = 2, etc.
Also, I think the short interest should be reversed, the shortSMA<longSMA. Instead of this indicator I used the 3mo Hi-Lo index of the S&P500 for much better returns. Also I use 4 ETFs for an 18% return.
Mr Piard is probably not that p123-savvy as other users, but the idea is ok. I limit my market timer to purely technicals, resulting in more frequent timing signals but lower MDD.
So I’ve been looking deeper into this, and have come across something odd with the Short Interest series I’ve created. I plotted the series on a fundamental chart, which looks good and smooth with only a few major crossover of 52/104. The screen seems to crossover more, in 2005 and 2013. What could I be doing wrong in the screen?
OK cancel this! Apparently the view I created in the fundamental chart is different, but the charts you can create right in the series view is accurate!