Price-blind (no value, no momentum) strategies

I was wondering if anyone has any experience with price-blind strategies.

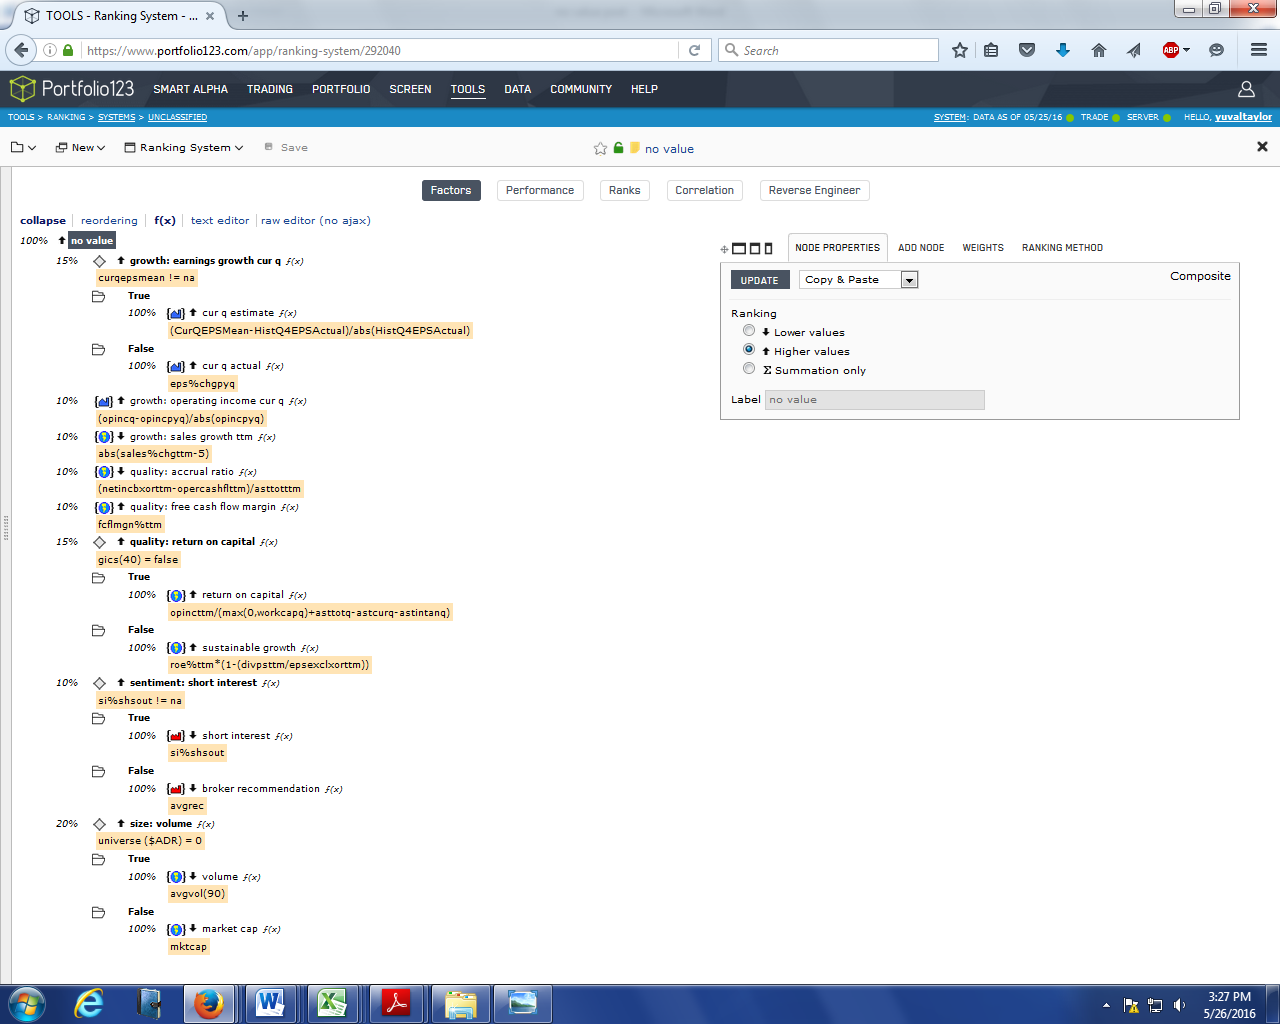
I have a ranking system that’s based on only eight factors: three growth, three quality, low short interest, and low volume. There’s not one reference to price (or market cap or enterprise value) in it. No value factors, no momentum. You can find the system here: https://www.portfolio123.com/app/ranking-system/292040.

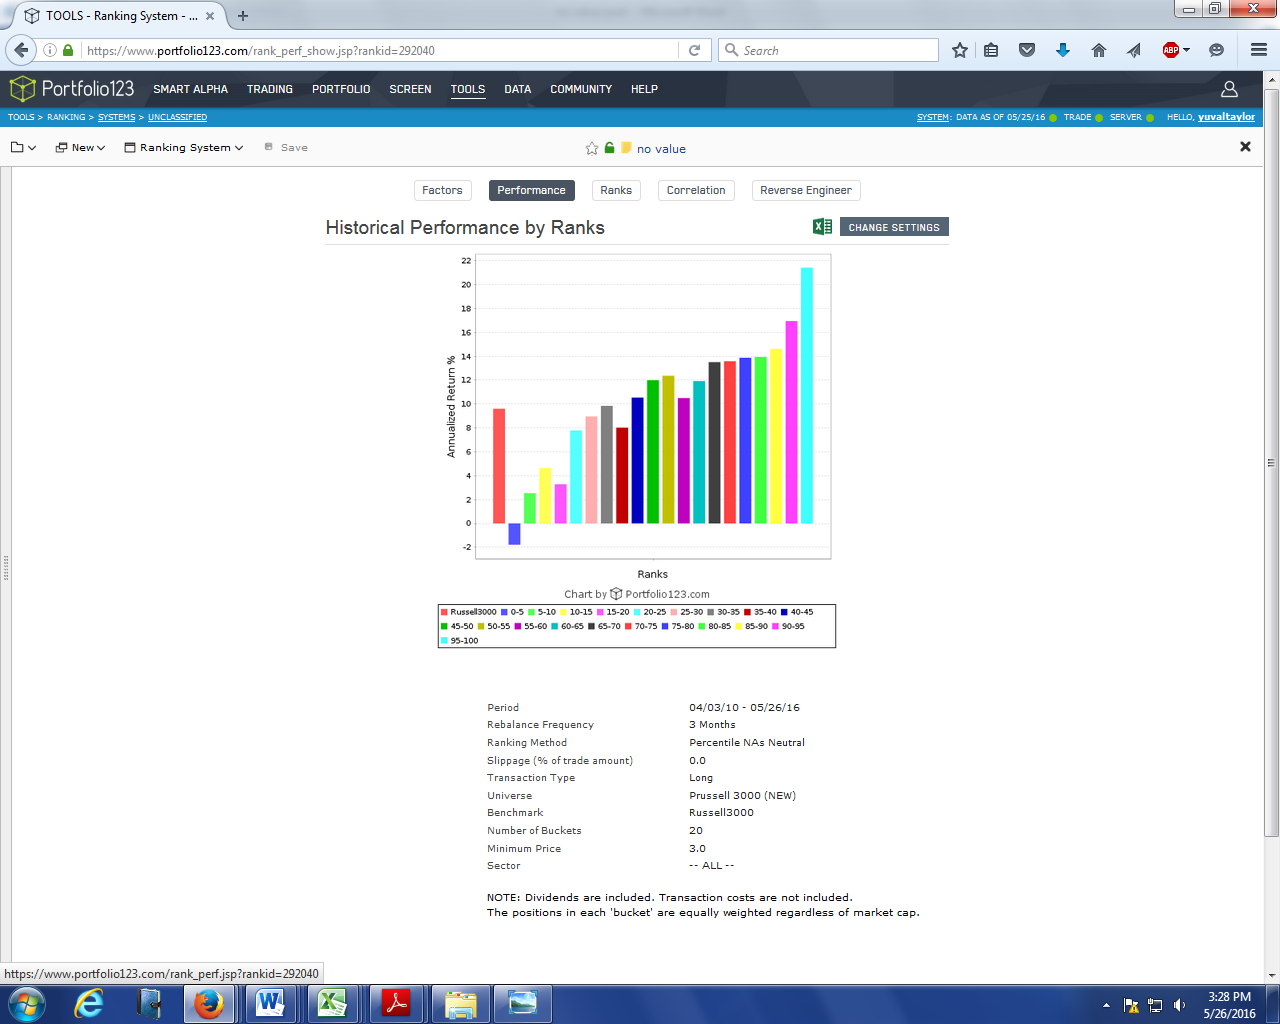
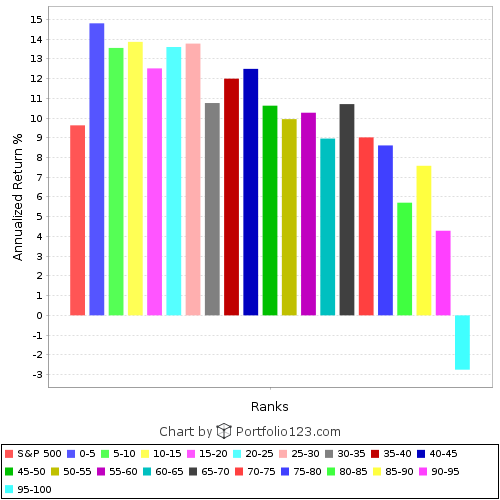
No matter how many stocks you choose from this system—the top 5 or the top 100—and no matter what universe you choose them from (SP1500, R3000, a universe that includes ADRs, even the SP500, though not quite as well), and no matter what time range you use, you’re going to handily beat the corresponding benchmark (so long as you don’t rebalance too often: a 3-month or 6-month rebalance works best; the slippage from a 4-week rebalance will hurt your returns). None of the growth and quality factors I’m using are terribly unconventional: EPS growth, EBIT growth, revenue growth (5% being ideal), accrual ratio, free cash flow margin, return on capital. Other growth and quality measures may work just as well or better—try them. It’s not overengineered—it’s vastly simpler than the ranking system I use myself. I’m sure you can optimize this system and improve its backtested results—I haven’t bothered. This system outperforms in bear markets and bull markets. It performed well in the last five years but it also performed well in the crazy markets of 1999 to 2001 and the various markets in-between.

I think T. Rowe Price would have liked this system. It reflects his basic thinking. Price did take value into consideration—he tried to avoid stocks with a p/e ratio much higher than its historic average—but I don’t think that was a major focus for him.

But this system contravenes Graham-Dodd, as well as the EMH.

Here’s my reasoning. The price of a stock is determined not by its intrinsic value, which is non-existent, but by the buying and selling of that stock on the secondary market. A company that is currently not attracting a lot of attention but, due to strong performance, will soon attract more interest among investors is going to see its price go up. This is very easy to understand, and not so terribly hard to predict. All you need to know is what investors are looking for when they begin to invest or substantially increase their investment in a company: revenue and earnings that are sustainable and improving. That will never go out of fashion because that’s the fundamental basis of any company’s success.

Perhaps price shouldn’t play such a big part in our stock-picking, and perhaps chasing after prices—whether low (value) or high (momentum)—causes us to lose sight of what matters most in the long run: a company’s likelihood to outperform. And that has nothing to do with the price of its stock.

Has anyone else explored price-blind strategies? Any thoughts?


Very interesting, Yuval. How did you pick the weighting of each factor?

I didn’t put much thought into it, really. I basically eliminated all the value-based ranking factors from the system I actually use (they made up about 20% of my weight), then winnowed the remaining factors down to eight biggest, then used the “normalize” button, then went to the nearest multiple of 5.

Hi Yuval.
Thank you for sharing the ranking system. I like it!
I think this is a good post:
http://www.valuewalk.com/2016/05/importance-roic-reinvestment-vs-legacy-moats/?all=1

Basically, over the long-term price or valuation metrics do not make the biggest difference (unless it is really, really expensive), over longer holding periods the quality and fundamental development of companies matter the most.

Yuval,

Thanks for sharing!

I have played with lots of ‘price blind’ systems, such as technical breakouts and mean reversion. I’ve also invested in many pattern based trading systems from outside providers.

But, if you are referring to both intrinsic value-less estimates and non-pattern based trading, I don’t think it will work out well.

Your system has some merit - buy small, growth companies - eventually people will catch on and they will become ‘hot’, at least some of them. That’s what Seed stage investors and early stage VC is all about - very high growth tech companies that are attractive acquisition or IPO targets. In many cases, they tend to ignore valuations - at least in the up cycle.

But, the best ones (like yCombinator) really control valuations, by running their own incubator. So, I don’t think it’s a good idea to completely ignore valuation over the expected holding period. Seems fraught with risk.

One of your factors:
abs(sales%chgttm-5) is actually a mean reversion factor right now. If this is changed to a higher is better, then it’s a growth factor, but system does ‘worse.’ So, this is showing a market overreaction to a drop in TTM sales is a source of alpha.

This factor produces identical results as:
sales%chgttm.
I don’t see any real reason to subtract 5 from the value or to take the absolute value. A company that lost 30% in sales TTM is NOT the same as a company that gained 30% TTM. So, absolute value here doesn’t make sense to me either.

Formulas like this also don’t make that much sense to me:
(opincq-opincpyq)/abs(opincPyq)

Why use absolute value in the denominator? Negative Operating income companies losing less this quarter than they lost last quarter will end up more highly rated then positive operating income companies who made slightly less this q than last q. Why would you want that? The absolute value seems to confuse things here. A negative number is fine in the denominator, just not a zero. If you want a more nuanced formula, have to use if-thens or nested logic structure to evaluate, but this doesn’t seem like the best way to handle.

There is no one who successfully invests who is not strictly a pattern trader, and/or who has a ‘long’ish’ holding period who will not try to calculate a company’s instrinsic value now or in the future. So, you have decide that you are trading some ‘pattern here’.

I haven’t gone through all the factors, but these were my first notes. But I like the idea and what you are trying.

Best,
Tom

O’Shaugnessy found a strong positive correlation to performance by combining low volume and price momentum. My guess is you are seeing a small company effect here. You mentioned that slippage was an issue for less than 4 weeks rebalancing so my guess is your model is finding mostly illiquid stocks that are undervalued. He talks about this in What Works on Wall Street.
I would put a liquidity floor on either your universe or your buy rules and see the effect on performance. Something like ADT60>$1M. See what happens.
Gerstein wrote a paper on just looking for quality companies with low beta. But no valuation factors (from what I remember). But his used SP500 companies. I think his idea was that you have to pay up in PE for higher qualty so he just let it float.
Anyway, thanks for sharing. It is always good to see other data points and rationals.

abs(sales%chgttm-5) with lower values better favors companies with an annual revenue growth around 5%. If a company’s revenue is growing around 50% that’s just as bad as if their revenue is shrinking about 40%. Neither is sustainable or healthy growth. And revenue growth of 0% is worse than revenue growth of 5%. That’s why the results are much better with that negative 5 in there.

You need the abs in the denominator of any growth percentage that might have negative numbers. EPS%ChgPYQ, for example, uses abs in the denominator, as does EPS%ChgTTM. If you don’t put that in there a company whose EBIT was negative last year and positive this year would show negative growth. And when you’re measuring growth, yes, “companies losing less this quarter than they lost last quarter will end up more highly rated then positive operating income companies who made slightly less this q than last q.” That’s what growth is all about. If you want to invest in companies with strong income, you look at the return on capital, not the income growth.

To get rid of extremely low or zero denominators distorting growth measurements, I might use, for example, max(2,abs(opincpyq)). I wanted to keep this one simple, though, for the sake of illustration.

As far as I understand it, T. Rowe Price, Philip Fisher, and their followers never tried to calculate a company’s intrinsic value. Price, in particular, classified companies as growing, maturing, or declining, and concentrated on growing companies. Price and Fisher were extremely successful buy-and-hold investors, and still have plenty of followers.

This is not a pattern. This is fundamentals. Pattern-based trading and trading technical breakouts aren’t “price-blind.” Their sole inputs are price changes. What I’m suggesting is that the opposite approach–completely closing your eyes to the charts when picking a stock–can work.

I’m afraid I simply cannot fathom how momentum can ever work. The idea that stocks that have risen in price over the past 6 to 12 months will continue to do so while stocks that have risen in price over the past 6 to 8 weeks will reverse makes about as much sense to me as proposing the same thing for people’s sleep patterns or weight gain. There’s no really solid theoretical basis to it. It’s no way to predict what’s going to happen in the future. It’s all smoke and mirrors.

The liquidity floor of $1M certainly reduces excess returns but does not eliminate them. This system works within the S&P 500 universe, not just for small caps, so long as you rebalance only every three to six months.

Yeah, the problem I have with momentum is that it is your friend until not. It is like watching a flock of birds darting first one way then another in the sky. no clear rhyme or reason. I understand that inertia is a law of physics but…
I only use it in one of my ports as one of many factors. I know others build on it as a centerpiece but I am just too uncomfortable with that. More power to them.

You absolutely positively are pumping the results with the small cap factor. If you really want to test the idea of price-blind, you need to suppress the mktcap factor.

Beyond that . . .

Value can never ever be irrlevant. One can choose to ignore it and many do, a topic I covered in the noise/value material in the on-line seminar. But to dimsmiss it, that’s like dismissing the laws of gravity. You can work with it overtly. You can work in ways that let it assert itself without your having done anything. (Yopur low-sales growth criteria is likely to correlate with value, for example; your accrual facgtor might be doing likewise). But to assume it doesn’t operate defines logic.

Beyond that, you’ve done the flip side of what Value ETFS do.

As explained in the seminar material, the theoretical ideal P/E is 1/(R-G).

Value ETFs sort on the basis of P/E (and analogous ratios) only and ignore 1/(R-G). Can it work in ranking systems? Yes. See, for example, the P123 Basic: Value system. This tells us that there are a good number of occasions whenj the 1/(R-G) does favorably align to P/E (as often occurs when themarket excessively exgtrpolates history, somethiong oftemn demonstrated by acadmicians). But it doesn’t mean you can’t do better by using a value ranking system in conjunction with buy rules that address 1/(R-G); a reason. why good value models tend to outperform value ETFs.

What you are doing is the other side of the coin. In essence, you’re ranking based only on 1/(R-G) factors and ignoring P/E type factors. So a decntly constructed ranking system along these lines can work the same way a value ETF works; all else being equal ofgten enough to get by, but maybe not often enough to allow a model based only on the ranking system to keep pace with one that uses the same ranking sysgtem but whichb prequalifies the universe based on favorable valuation.

Oh my. You reminded me that I really do have to get off my you-know-what and get going on the Momentum material dfor the on-line seminar. Hint: There are good rerasons why it can work, and it is definitely not smoke and mirrors, if done thougtfully.

It’s difficult to tell how the ranking system does with the S&P500 constituents w/ P123. Probably the best available benchmark to use is “S&P 500 Eq Weight” and AFAIK that’s a price return index and not a total return. If I ran the sim correctly, the reported alpha is 3.44% (annualized). With a total return index, it would be lower but I don’t know by how much.

Reportedly, each S&P price index has a total return counterpart. Is there a reason P123 doesn’t offer them up as benchmarks?

Walter

Seems like with all the fundamental growth factors, it may unintentionally end up picking price momentum stocks.

If you want fast growing companies that other investors have not found yet, maybe keep the fundamental growth, then add value (out of favor), or penalize price momentum (look for stock prices that are flat or going down).

I did suppress the mktcap factor. I used low volume instead. That’s why it’s price-blind. Low volume is not the same as low market cap. They usually coincide but the principle is entirely different. And I’m saying that even if you’re using a universe like the SP 500, this system will still beat the market. There are always going to be some stocks that are less active than others, and the key is to invest in those provided that they show strong signs of sustainable growth and high quality earnings.

I agree that using relative value factors will definitely improve the results of the system I’ve proposed. I just wanted to make two major points. First, that there can be both a solid theoretical and practical basis for investing in relatively ignored but growing companies regardless of their value. And second, that the price which a stock commands on the secondary market makes very little difference to how well a company actually performs. I guess it comes down to this: a company’s performance will influence the price of its stock; a company’s stock price will not influence its performance (well, not much). Given that, it’s better to place your bets on performance than on price.

Well, for one thing, in order for a company to rise from small cap to large cap, it DOES need to have significant price increases on their stock in between. For example, look at NetFlix. There had to be a lot of price momentum somewhere in order for it to increase 100-fold over 14 years. That’s not to say it hasn’t had significant downward price momentum at times, but in spite of it.

Wasn’t there a group (Blackrock?) that did a study where they got very good returns on price momentum? They defined it as the stock hitting a new ALL-TIME high – the ultimate definition of momentum. And they they had some form of simple exit criteria. Although that would have had you out of something like NetFlix for several long periods of time, as it had to recover after a significant drop to get to a new all-time high.

But at least the all-time high removes the ambiguity of whether to use 6-month, 12-month, or whatever. For those, the question arises – why is that particular length of time significant to all stocks?

IBD’s Weekend Review stocks have done very well versus the S&P 500 over the years (335% vs 117% since 2005), and one of it’s base factors is the Relative Strength Rating, based on the ranking of a weighted quarterly price change over the previous year. In my experience, the lowest and highest RS values tend to out-perform the middle values. They are the ends of a bell curve in terms of the weighted quarterly price change. There may be only a little difference between a stock rated a 40 vs a 60, but a huge difference between a stock rated 90 vs a 92. I tend to think of the lower rated stocks as “possible turnarounds” and the higher rated stocks as “momentum”, but both have a good share of stocks that crash and burn – especially on the low end, because some of them are stocks of companies that are dying (in essence, a negative momentum price-wise, because price is following the fundamentals).

MisterChang, thanks for the idea “penalize price momentum (look for stock prices that are flat or going down)”. I tried (abs(26W%Chg)) (lower is better) and it gave me interesting results for stocks with flat pricing.

There is (at least) one reason why momentum works. The reason is that it acts as a bad news filter. When company news is released, there is a time delay from when HFTs and the general public get the info to when the news is processed by Portfolio123 and available to our portfolios. The delay is one or more days for largecap stocks, and one or more weeks for smallcap stocks. If momentum is there then one can assume that there is no bad news in play that our algorithms aren’t aware of yet. The effect would be more noticeable for smallcap stocks due to the more significant delay.

Walter - I believe (I may be wrong) that total return is one day delayed due to dividend reporting. This causes system display to be one day behind.

Steve

But why would price increases in the past suggest future price increases? Is it more likely that a stock that costs twice as much as it used to will double in price again or go back to where it was? There’s nothing in its price pattern that will tell you that.

I grant that some people have had a great deal of success following momentum strategies. But I also believe that more people have failed than have succeeded. Maybe it’s a case of once bitten twice shy. I tried it myself, studying technical analysis, buying and selling based on stochastics and sophisticated trailing stops. Never again.

True. But at the same time, stocks with low price volatility outperform stocks with high price volatility. Try using this as a ranking factor: priceH/priceL. You’d think, given what you just said, that stocks with a big difference between their high and low prices would outperform stocks with a very low difference. But the result is the opposite.


406699_69381.png

Marc–Thank you.

I look forward to an in depth discussion on momentum but by itself it doesn’t work. Close(0)/close(125), weekly rebalance for a moderately liquid universe. See below: you would be better off buying the 5, 10 or 15 worst performers than the 5, 10 or 15 stocks with the most momentum. And generally pretty flat.

Maybe Marc can help explain what momentum works with and why.


Jim - you should cut down on the number of buckets to say 10 or 20. Otherwise you are looking at noise. Also use a standard universe like SP1500 so people can compare their results with yours.

Cheers
Steve