The Google Investing Index tracks Google searches related to the stock market. Big market volatility causes big spikes in this index. This may help us orient our emotions at the time of the crash; i.e. if we feel nervous then we can check the Google Investing Index. If it shows a huge spike then it is a sign that the market just got as exciting as its going to get. This is a bullish signal, and may help us manage our emotions.
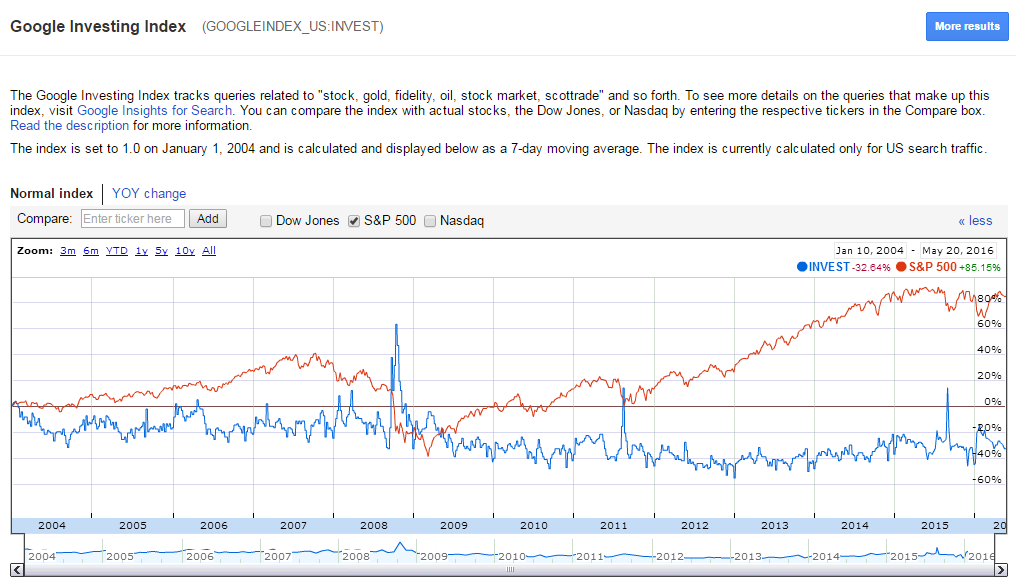
I wouldn’t put a heck of a lot of faith in it because you don’t know how high the index can really get. In 2008, one would probably have lost one’s shirt using the index as a gauge ![]() How does it compare to VIX?
How does it compare to VIX?
Steve
Hi Steve,
I’m not looking at the absolute level of the Google Investing Index. I’m eyeing a steep sudden spike followed by a steep drop to normal levels to indicate that there was a spike in financial news followed by a return to normal levels. This signals that the bad news is history. If more financial news would be coming then people would probably be paying more attention to it.
This indicator may also be useful as a psychological aid to help me overcome my fear. When volatility spikes, I have a tendency (and I suspect that I am far from the only one) to extrapolate recent events into the future and expect even more volatility going forward. A chart like this keeps things in perspective for me and reminds me just how abnormal the recent market event was. This prevents me from doing something foolish like selling at the bottom to protect myself from imaginary further declines.
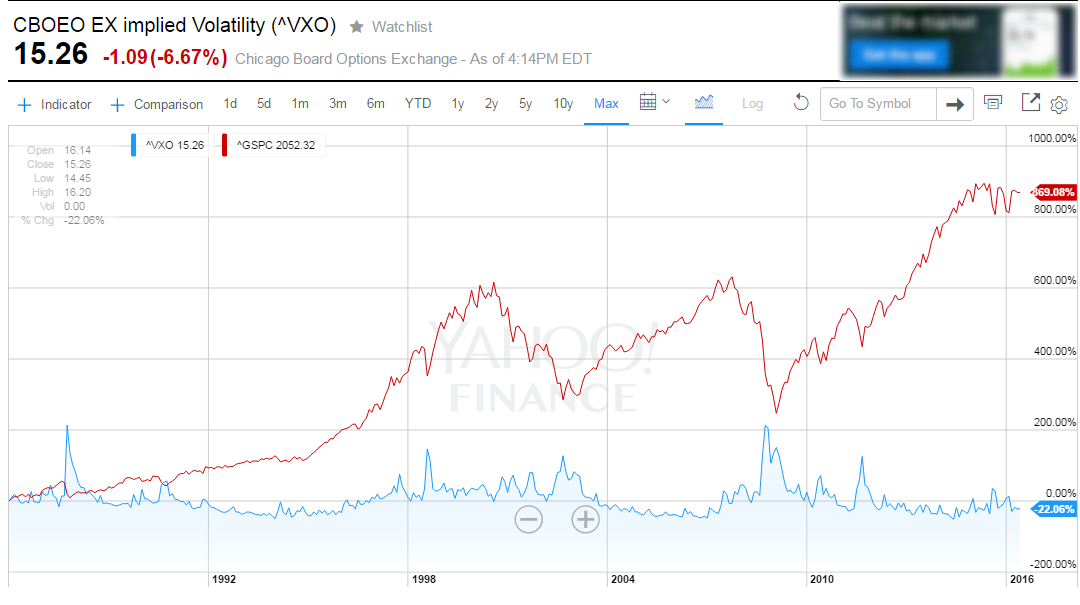
As for using volatility, that’s fine too. For comparison, here is a chart of the VXO volatility index. (The VXO has been around for longer than the VIX).
However, the VIX is not perfect either. Studying the volatility chart, I don’t see a clear pattern in the spikes. Furthermore, as with the Google Investing Index, I don’t see a clear pattern in the absolute level of the volatility (although I will grant that there seems to be a weak pattern). Furthermore, even if in the past there was an ideal cutoff number, this number may change as the market changes. For example, it may be influenced by the percentage of investors who use options, the introduction of volatility ETNs and the hedging that their issuers must do to lock in their profits, and some other factors. The options market today is not the options market of ten years ago (option trading volume has increased massively), so you need to look at past results with more caution than usual.
Summary: Neither the VIX nor the Google Investing Index is a perfect predictor of future volatility. Still, each one will probably be correct some of the time.
Chaim
Chaim-Thanks! I did not know about this. Interesting and I learned something
–Jim
Interesting.
I think sentiment measurement is important, but it’s easier to express that ideal than it is do implement an effective measurement protocol. For example, I wrote a couple of articles a week or so ago on Forbes bashing WIZE, the newly launched CrowdInvest Wisdom ETF because they build their portfolio based on net bullish votes cast by users of their iOs app. My gripe was that this is a horrible way to measure crowd sentiment.
I could not find a good description of what, exactly, Google is doing (their links led to nonsense). But the idea is intriguing and conceptually, I like it better than VIX an its overreliance on a mathematical formulation (Black Scholes) which may or may not represent volatility as effectively as mathematicians expect.
I can’t say Google’s index is the greatest thing ever, but I could see where is can make an important addition to timing models. A major drawback of the timing model used by many on p123 is that it’s based on SP500 estimate trends, which is all well and good and which can, as we see with 20-20 hindsight, catch some big drawdowns, it is unable to catch drawdowns based on news flow or sentiment, such as the big one the timing SA models missed in 2011.
Technical analysis is not my area of expertise but I know enough to be able to see how those who are good at this (i.e. those who transform raw numbers into more useful models and who use multiple data sets as confirmations, etc.) could work with it.
Conceptually, I’d love to be able to see something like this brought into P123. But even if its technically feasible (that would be Marco’s call) so far my searching on the Google site leaves me uncomfortable with the legalities of doing so in the way we would want to do it. But it’s an idea and may be a window into the possible future direction of technical analysis and market timing.
Looks like any signals you might extrapolate would be too late. -Debbie
Not necessarily.
This is not a trend indicator; it’s a strength of sentiment indicator and would need to be used in conjunction with other indications of trend or reversal.
So,
It does seem a little late on the tops. But is it good for the bottoms? If so, is it flashing a buy signal now (or did it recently)? We had the 3rd highest spike recently and it has settled back down.
By itself, it’s not likely to mean much of anything. Good technical systems involve multiple metrics.
Visually, it seems reasonable to assume there is something tbere. But to build s specific model, one would need to resort to the skill sets of those who build serious trding systems (a group that excludes me, but there’s a ton of material out there from others who are expert on ths sort of thing).
I have always found that eye-balling is a poor method of determining whether or not a trading concept will work. You can learn a lot by expressing the visual pattern mathematically and then backtesting. Looking at 2008 again, there are two spikes followed by a “return to normal” (what is return to normal expressed mathematically?). If one entered the market at the return to normal one would very shortly be under water by a significant amount ![]()
Perhaps this would be useful as part of a multiple indicator strategy though. You also need to be careful to understand how the data is collected by Google. I didn’t look into this but it could be monthly data or delayed data.
Steve
Just as I argue that people need to understand how fundamental analysis works, the same holds true of technical analysis. Those who REALLY know how to do this don’t just eyeball and test and rarely if ever use any indicator in isolation, even something like MACD, which is a super-iindicator built on the idea of combining a trend test with a confirmation all in one number (but even this isn;t enough since MACD tends typo be used as one piece of a larger system).
For those interested, I’m afraid I’m not the person to provide much help since this is not really my skill set. But there’s plenty out there. I can’t recall names off hand (it’s been ages since I tried – and failed – to master this stuff). But if you Google Traders Expo and then Google the major presenters, you’ll start bumping into some worthwhile names. Also, check the folks who sell add-ons to the basic Meta Stock product. I know the folks who run Meta Stock and they won’t develop and market an add-on based on the work of anybody who isn’t legit.
As new data sets come out, I would expect the trading community to figure out how to work with it. That said . . .
This is one part of the reason why I feel uncomfortable with the legalities and why I do not now plan on trying to get it into p123. But that’s today. What’s true today may not be true tomorrow, so it’s always a good idea to be aware of how the world is evolving.