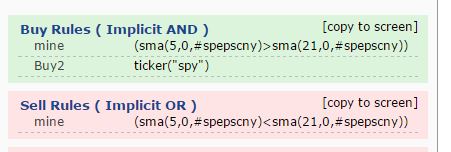
I created a simple simulation where I buy and sell SPY when its SPEPSCNY 5/21 week SMAs cross.
the simulation is here:
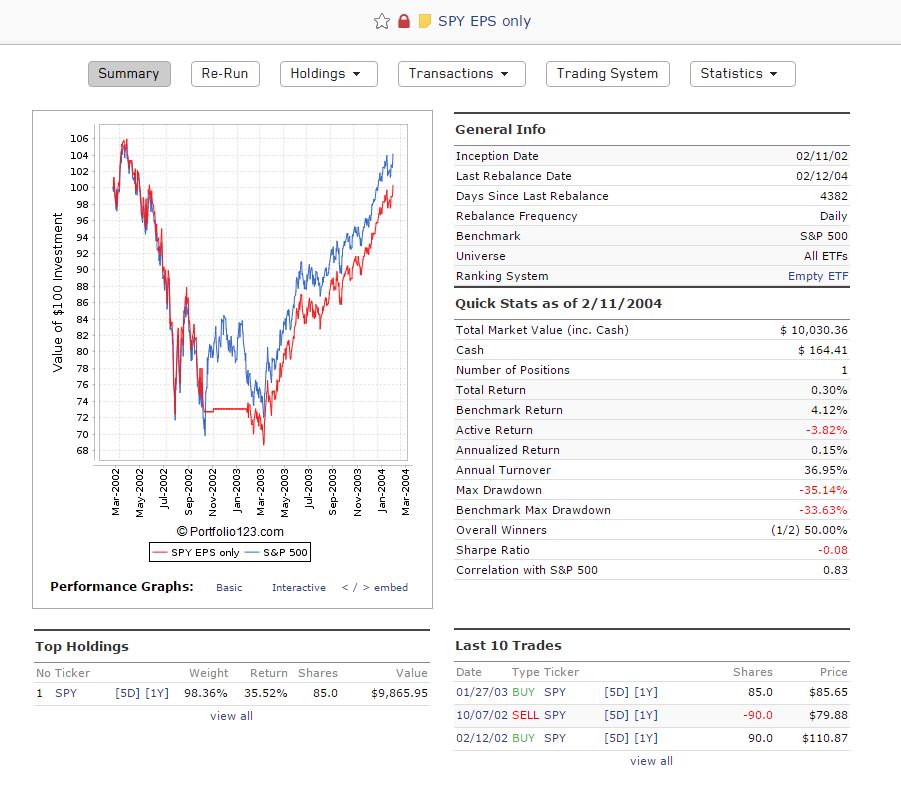
https://www.portfolio123.com/port_summary.jsp?portid=1411564
Notice that in the sim that it buys SPY on Jan 27 2003 when the Buy rule is true (5W SMA>21W SMA) .
The image from the sim is below.
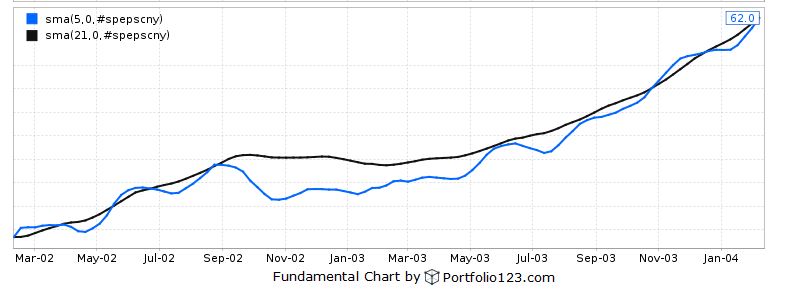
Just to help me visualize the data, I then created charts for the same SMAs in Data->Fundamental Charts. I got the charts below for the same time frame.
What bothers me is that the sim and chart don’t agree (at least from what I have done). the Fundamental chart does not show the 5W SMA crossing the 21W SMA till October, 2003. This is ~8 months after after my sim’s date of Jan 27.
Anyone have an idea why my sim does not jive with the data in the Fundamental chart? I have a feeling I am doing something wrong but cannot identify it. Right now I am not sure which is correct.
Thanks for any help.