Hi
spepscy is gone ![]()
I can not find it anymore in the list of buy and sell criteria, though the sims
using it do function.
Any reason for this, should this factor not be used anymore?
Also in the fed model it disapeared.
Best Regards
Andreas
Hi
spepscy is gone ![]()
I can not find it anymore in the list of buy and sell criteria, though the sims
using it do function.
Any reason for this, should this factor not be used anymore?
Also in the fed model it disapeared.
Best Regards
Andreas
Hi Andreas,
go to data/ Fed model/ doawnload Excel and you will see it in column I -it has moved but it is still there
Brian
Thank you.
Question for p123, any reason for hiding it?
Regards
Andreas
I have the same questions as Andreas. I found it a convenient reference to have the charted spepscy on the data page and would appreciate it if it is restored.
Scott
I agree with Andreas and Scott. It might have flaws but it is still useful to see how spepscy (and spepsny) has moved recently.
David
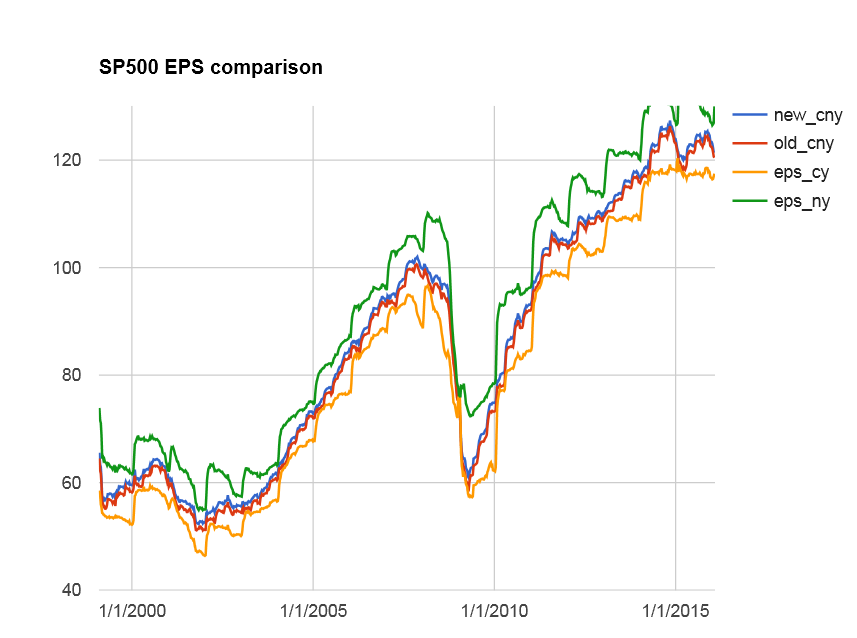
NY & CY estimates are completely misleading when used in a time series chart, specially around Jan & Feb when most companies change calendar years. Recall what they represent: the estimate for a fiscal year. As the fiscal year ends, NY becomes CY with the inevitable jump in values. This jump seems to strongly indicate an upward revisions, but for the few that understand what’s going on. This why you won’t see Cy & NY in other places like http://www.yardeni.com/pub/peacockfeval.pdf . Rather they are charted as short lines over the blended CNY time series. THat is the correct representation since the trend for each of those lines is meaningful. I simply cannot make any valid case for them as a time series. You can still access them in your rules, but they are no longer visible in the fed model nor the rule reference. I would encourage switching your systems to the blended series.
NOTE: we tried to reproduce the smoothness of the lines in Dr Yardeni’s pdf using weeks & even days into the year to slowly transition more & more of the Next year into Curr year with little success. They new CNY are a bit smoother than the current ones that use the Quarter # to slide in the values, but not much. I have a strong hunch that there’s a bit of behind-the-scenes smoothing going on in Yardeni’s pdf.
One more thing. In Yardeni’s pdf, the squigly lines over the CNY series are not our CurrY & NextY. They are estimates for the specific year. That is also the correct way to do it. I don’t think they are worth the trouble to re-create since the CNY is enough IMHO
So you have changed the data in the CNY series?
Hugh
No the CNY has not changed. You can see the new one below or in this google drive spreadsheet:
As you can see the CNY is in between the CY & NY , as it should be , and the new one seems a bit smoother. Probably not enough to justify changing it. Using quarter # to slot in the CY is a perfectly valid way to do it (Compustat does it with Q#).
I agree that the end and beginning of year SPEPSCY data is unreliable.
I mention this in this viewthread: http://www.portfolio123.com/mvnforum/viewthread_thread,9380_lastpage,yes#lastpost
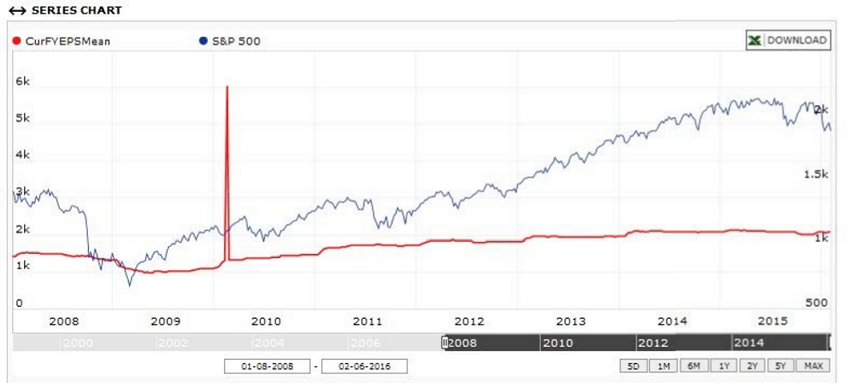
Also there is a blatant error in Feb-2010. In Jan-2010 SPEPSCY jumped from 62 to 75 within one month. See also chart below where the spike is shown.
Estimate data is very spotty before 2000. Reuters was the same.
The SPEPSCY jump in 2010 is legit. It’s simply CY switching from 2009 to 2010 . This is precisely why CNY should be used instead.
Make sure you exclude berkshire with: UnivExclude(“BRK.B”)
We have not been able to resolve the issues with berkshire switching “primary” stock from A to B on the Compustat side while CapIq maintained A as the “primary” issue.
ok, thank you!!!
Hi, Marco:
Is it possible to show us a sample #SPEPSCNY in “Custom Series” so we can adjust it if necessary? For example, I want to see some sector-specific EPSCNY.
Thanks a lot.
Hengfu
Marco,
The Feb-2010 spike was due to berkshire.
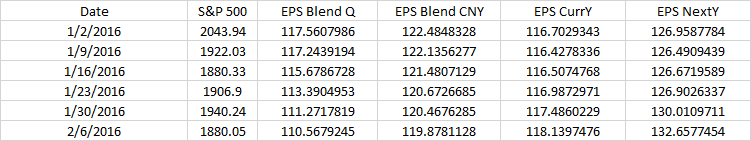
But please explain how P123 calculated the last value (2/6/2016) of EPS CurrY = 118.13975 in the FedModel.
That would be the with the Friday 2/5/2016 data.
I one uses the custom series MySPEPSCY to calculate this value then it becomes 113.84. There is a huge difference here.
For the previous 4 weeks the difference between the FedModel data and the custom series values was much less.
Thanks.
A good place to start is here: https://www.portfolio123.com/app/series/summary/37?st=1&mt=8
I have created custom series for blended, sector specific estimates. Very helpful to understand relativ sector strength / weakness.
Thanks, but your example is using CurFYEPSMean.
I am looking for the BlendCNY item to construct #SPEPSCNY specified in
https://www.portfolio123.com/doc/doc_detail.jsp?factor=%23SPEPSCNY&popUpFullDesc=1
#SPEPSCNY: Calculated using a blend of the Current and Next Year estimates for the S&P500 stocks. The weight given to the CurrY and Next Y depends on which quarter was the most recent. For each SP500 stocks the following is calculated:
BlendCNY = if Q4 then (CurFYEPSMean)
if Q1 then 75% (CurFYEPSMean) + 25% (NextFYEPSMean)
if Q2 then 50% (CurFYEPSMean) + 50% (NextFYEPSMean)
if Q3 then 25% (CurFYEPSMean) + 75% (NextFYEPSMean)
The SP500 Blended EPS is then computed as
num = Sum { BlendCNY (i) * Shares (i) }
den = Sum { MktCap (i) }
#SPEPSNY = ( S&P500 Close * (num/dem) )
Geov, 113.84 is coming from you clicking “Totals” right ? There’s a issue with clicking “Totals” on a Monday. It’s uses the benchmark last date available to set the “as-of-date” for the estimates, but that’s a Friday, so it’s missing this weekend data. The backtest, or time series generation, is correct though.
Long story short… we’ll investigate “Totals” so that it’s not confusing. It was always meant to be just a way to spot check data.
Marco, Thanks a lot for this explanation, very much appreciated. I noticed that the graph showed the higher value at the end, in line with the FedModel data.
As I said above, my link is a good point to start, not the final solution. Just use “month” and “eval” for quarter-specific blends.
.
Not sure how P123’s SPEPSCNY is computed or if it is computed correctly.
Since P123’s EPSCurrY and EPSNextY are both going up right now, why do we have falling SPEPSCNY? See attached chart.
As Cyberjoe suggested, here my version of SPEPSCNY:
https://www.portfolio123.com/app/series/summary/4075?st=0&mt=8
The EPS Blend CNY I got:
1/2/2016 119.2668457
1/9/2016 118.943634
1/16/2016 119.048645
1/23/2016 119.4662094
1/30/2016 120.8971024
2/6/2016 121.7691879
My SPEPSCNY is going up. Anything wrong in my formula? Any idea?