I am familiar with the definitions of each of these. I am familiar that EBIT and EBITD are both non-leveraged.
However, perhaps I am missing the point, but it seems to me that a company that earns more in spite of leverage costs (interests) relative to its total cost is a better company.
Of course, I have backtested this back to 1999 and found that it is not the case that Net Income is a better representation. However, 16 years is a relative short timeline, and over 50 years, the picture may look different and the last 16 years may be a mean reversion period.
I know that there is something perhaps that I am missing in the meaning of non-leveraged and leveraged and why that’s meaningful. As someone who runs a business, I can’t quite get at why EBIT or EBITD in the numerator would create better measures.
Leveraged returns that are higher than non-leveraged returns don’t make a company inherently better or worse. That has more to do with how the world turned out to be. If things go well, you always expect leverage to outperform non-leverage all else being equal. In bad times, absence of leverage always wins, again all else being equal. (What makes life interesting is that all else rarely turns out equal, and the success or failure of a model often hinges on how effectively it copes with the grand “all else.”)
The main difference is where the company sits on the reward-risk continuum. As a company raises leverage, it moves up the scale. All parts of the scale are equally good or bad – the only important things is that your model successfully puts you in the portion of the scale in which you want to be.
A good leveraged company can be defined as such compared with other leveraged companies. A good non-leveraged company can similarly be defined as such compared with other non-leveraged companies.
A great example of what Marc says is what is happening to US oil fracking companies now. Life was good when their return on invested capital, including copious debt, was high. But their profit and income now cannot cover what they have borrowed from others so many could go out of business. If they had levered less (but had lower resulting growth as a result) then they would not be staring bankruptcy in the face right now. The downside of using other people’s money.
I don’t think I follow the reasoning in either of these responses, although I agree with the points individually. (EDIT: To be clear, I understand that leverage can increase returns and risk for companies, but I didn’t initially understand why you would take out interest from the numerator of the ratios) I agree that debt increases risk. So, throwing interest into the numerator as a cost would decrease the NI/EV, thereby making the business less attractive to buyers.
On the drive to work this morning, I realized that in the event of a purchase of a company (an event where EV is a number that is paid for by a 3rd party), the future income of that acquired company would no longer include interest from prior debt (I think this conclusion resolves my initial question). The purchaser would pay a new interest amount, or if in cash, no interest.
Therefore, it is not logical to include interest from the company’s prior year because that is no longer the amount the company would pay.
So, with this reasoning in mind, I set about to do another backtest NI/(EV-total debt). I reasoned that if we back out total debt from the denominator (with the assumption that a 3rd party manages to purchase the company and just transfer the debt obligations), that the purchaser would still pay the exact same interest that the acquired company was paying in the prior year.
Unfortunately, the returns on NI/(EV-Total debt) fall short of EBIT/EV and EBITD/EV. Now this opens another mystery for me. Why arn’t returns for EBIT/EV and NI/(EV-TOTAL DEBT) the same or similar?
The EV ratio I find most useful is EV to unlevered free cash flow (cash flow from operations minus capex plus about 3/4 of the interest expense, if you think the effective tax rate is 25%). And it’s better to flip it and use UFCF/EV (higher values being better), since UFCF is so often negative, and that’s not a good thing. Unlevered free cash flow is one of those things it’s important to compute for DCF analysis, but I think it works pretty well for comparative valuation too.
That said, there are some real drawbacks to using EV ratios. First, when you’re buying stock, you’re buying equity, not the whole company. The whole company might be cheap or even have a negative value but how cheap is the stock? If you’re looking to buy a bargain shirt, you don’t look at the value of the store. Second, if you rank companies by a cash-to-assets ratio, you’ll find that at least over the last five years those with the most cash perform the worst. Third, if you rank companies by most debt-to-whatever ratios, you’ll find that companies with more debt perform better than those with no debt. The reasons for the last two are that a) small growing companies need more capital than they can get by issuing equity; b) banks only offer loans to companies with good prospects; c) a company that has a lot of excess cash isn’t using it to fund further growth (there was a nice article on this in the New York Times magazine recently).
Oh, and to respond to the last question about NI/(EV-debt), there are two big differences: NI is after taxes and EV deducts cash and equivalents. It’s better to stick with NI to market cap, the same more or less as EPS to price. Forward EPS, preferably.
I think historically the use of EV (instead of just mrkcap) was for small company acquisitions. EV was compared to EBIT or FCF to see how long it would take to pay off the acquisition with the profit/cash that the acquired company generated. Since many smaller companies don’t have a lot of debt (they usually initially fund through equity), I am not sure that debt was originally conceived to be a big portion of the acquisition cost (the same for cash since small companies are usually cash poor except right after they offered equity).
Lately it seems many people are using EBIT/EV (for instance) to value larger entities, maybe as takeover targets when the entity’s growth has slowed or they have run into some kind of trouble (and hence their stock price is down). This could be used in oil patch companies who have run up a lot of debt as their revenue has gone down.
Backing out debt from the definition of EV might give you an erroneous indication. I think it is better to stick with standard ways of defining things to maintain alignment with the investing community, who ultimately sets the prices for valuations.
Yuvaltaylor: Thanks for the feedback. EV is still my preferred method of valuation based on backtests I’ve seen as well as my intuitive understanding about what I would like to use if I was outright buying a business. To make up for the too much cash conundrum you are talking about, I actually screen for current ratio>1.5 and <4. I’m sure this could be improved, but it gets at the same thing.
davidbv: I would agree with you that it is likely better to stick to what is generally considered to be the gold standard for valuation as that is likely what others are looking at and also buying. Still, the contrarian in me wonders if NI/(EV-total debt) may become better because of the fact that it is not being used. I am likely wrong on this, though, as the very nature of abnormal momentum returns are in part based off of the fact that others are all doing the same thing.
The reason net income isn’t compared to enterprise value is that it’s a metric specifically designed to calculate what’s left of the company for shareholders after all other claimants have been paid. It’s the bottom line. It has little to do with the net worth of the company. EBIT applies to the entire company–the shareholders, the debt holders, the preferred stockholders. So it’s a good fit with EV. And if you use NI/(EV-total debt), you’re going to get really confusing results because companies with lots of cash and lots of debt will have a negative denominator. Right now there are quite a few companies with negative enterprise values, which already causes valuation problems, and those problems would increase. Since EV = market cap + debt - cash, NI/(EV-total debt) is the same as EPS/(price - cash per share). Which is a pretty strange ratio. And maybe I’m a sucker for conventional valuation techniques, but I think the reason ratios like P/E and EBIT/EV have survived so long is because, if used in conjunction with other valuation metrics and evaluation of growth potential, they’re actually predictive of a business’s future, not because a lot of investors are using them.
EBIT/EV and FCF/EV puts a value on the engine of the business operation itself without so many of the accounting gimmicks. NI/MktCap values the shares as well as the cleverness of the firm’s accounting department. Both have their place.
Yuval: I ran a backtest filtering for positive EV-total debt values in order to get rid of “weird data”. The backtest doesn’t change results much unless I use last year’s debt (+2% CAGR over TTM) versus TTM debt. Still, not sure if the differences are significant. But, I understand what you are saying about using normal ratios and paying attention to what the numbers actually mean.
I ran a seperate screen for stocks with negative EV and I can’t find any at all from 1999 to present. Can portfolio123 actually screen for this? I’ve seen some interesting results for negative EV stocks.
I am a little purplexed by something new that happened. Three days ago, the return on my backtests for the NI/(EV-total debt) annual rebalance screen (with > 50 market cap, net income ttm> 0, current ratio >1.5 <4, close(0)>5) was 15%+ annually. As of today, the return has dropped to 12% and the drawdown increased. I have not changed any of the inputs. Any ideas?
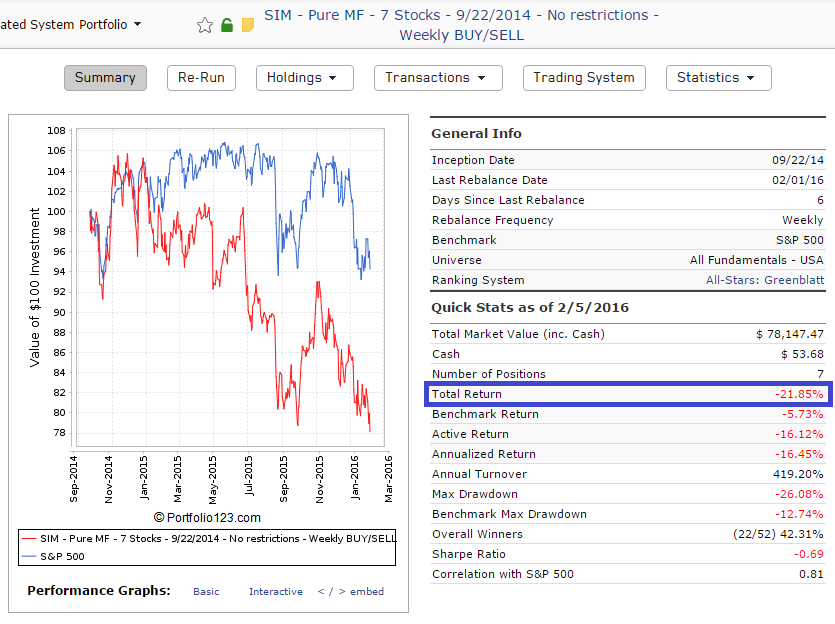
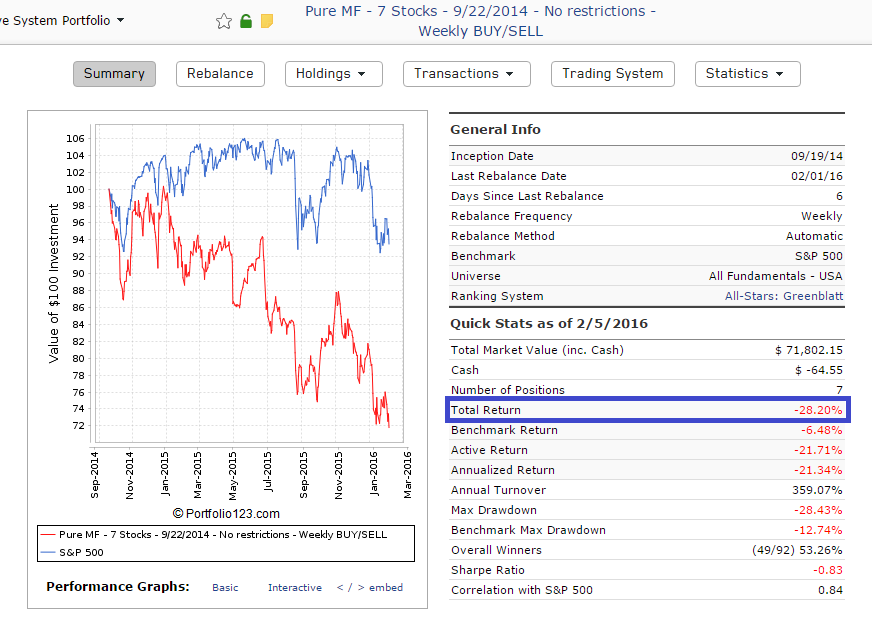
I am finding big differences between simulations and live trading when using EV ratios. For example, compare the automatically rebalanced portfolio to the sim. Notice how there is a 5% drop in performance for simulating live trading vs. simulated backtests? This seems to indicate that Compustat is going back and fixing data errors retroactively. This makes simulations misleadingly good.
EDIT:
You can check these out yourself. Click here for the simulation. Here is the automatic trading results.
There are at least two differences between the Live Port and simulation that could account for some of the mismatch;
in May 2015, prices for Live Port transactions were changes to that of the transaction day (H+L+2C)/4. Prior to May, prices were taken from the prior day close. I’ve seen large differences between long running LPs and sims that were reconciled only when the sim was changed to use the prior day close price. The LP transaction list shows the use of both price types.
the sim sets Price for Transactions to ‘Next Open’. That should be ‘Next Average of High and Low’.
I’ve only been a portfolio123 paid subscriber for less than one month. You guys have been here for 5 years. Surely this is something others are noticing or have brought up?
I do like the easy programming behind p123 and its features, but the very fact that backtests only go back to 1999 was only okay for me because portfolio123’s data is supposed to be scrubbed and from what I had read, their simulations were supposed to be accurate.
If the results aren’t accurate, this poses quite the problem. Has this been a recurruing issue or are these new problems?
Walter, thanks. You are correct about the price calculation.
I am more concerned about the fact that there were many different trades altogether. Some examples:
ACHI was sold by the sim on 3/30/15 as a NO RANK transaction, but the actual port held it until 6/29/15 when it was finally sold after it dropped out of the top 7.
There were a number of buy and sell transactions for CTCM, HCI and KKR (presumably because they kept dropping in and out of the top 7) in the sim that were not in the port.
Sim: Bought KING on 10/20/14. The port bought it a month earlier, on 9/22/14.
Good call on $EV. I think it may capture a local copy of $EV. That is, if a user defines a custom formula $EV, the P123 Greenblatt ranking system would use the local version and not the P123 version. Seems to work that way for me.
Thanks David and Walter! I can confirm that I do have a custom formula for $EV, it is not exactly the same as the P123 version and that I recently changed it. That may explain a lot of the differences.