Hi all,
after having read Marc Gerstein’s topic 3B on Price to Sales in our collaborative group, I started to play around with the sales function.
With the goal to screen for companies with rising sales within the last two month I started to compare results of the following two formula:
Sales(0,TTM)
Sales(2,TTM)
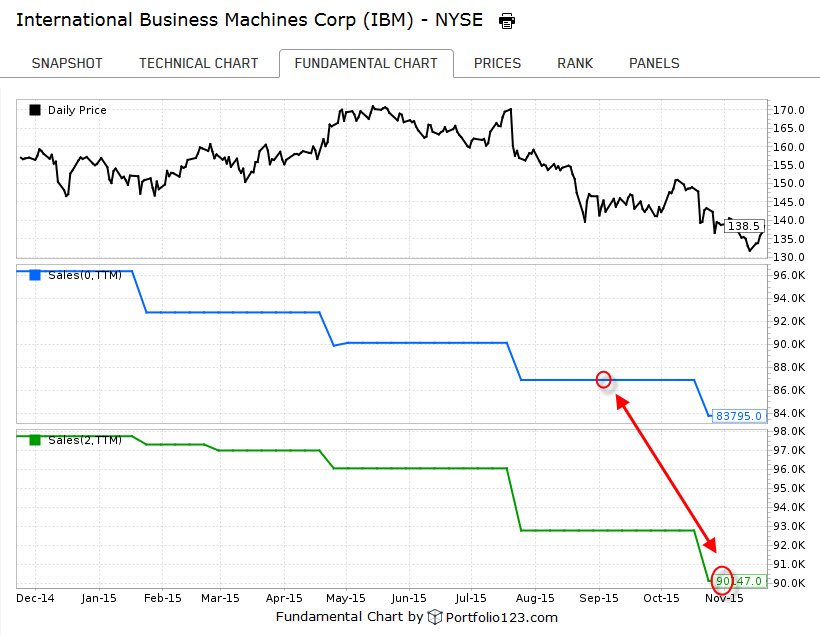
From what I understand in the help reference an offset of 2 would basically give me TTM sales for two month ago. However, this does not seem to be the case from what I can see in the attached fundamental chart. Sales(0,TTM) gives me a sales number of 87 bln for IBM in mid September. Expecting a two month delay, Sales(2,TTM) should give me the same number for mid November, but the reported figure is actually 90 bln.
What am I missing?