I started this post in other branch but decided to make a separate theme for discussion.
So we discuss stock return forecasting models.
Stock movements can be decomposed into two pieces:
- Market movements
- Stock specific movements
First, let’s start from the market part.
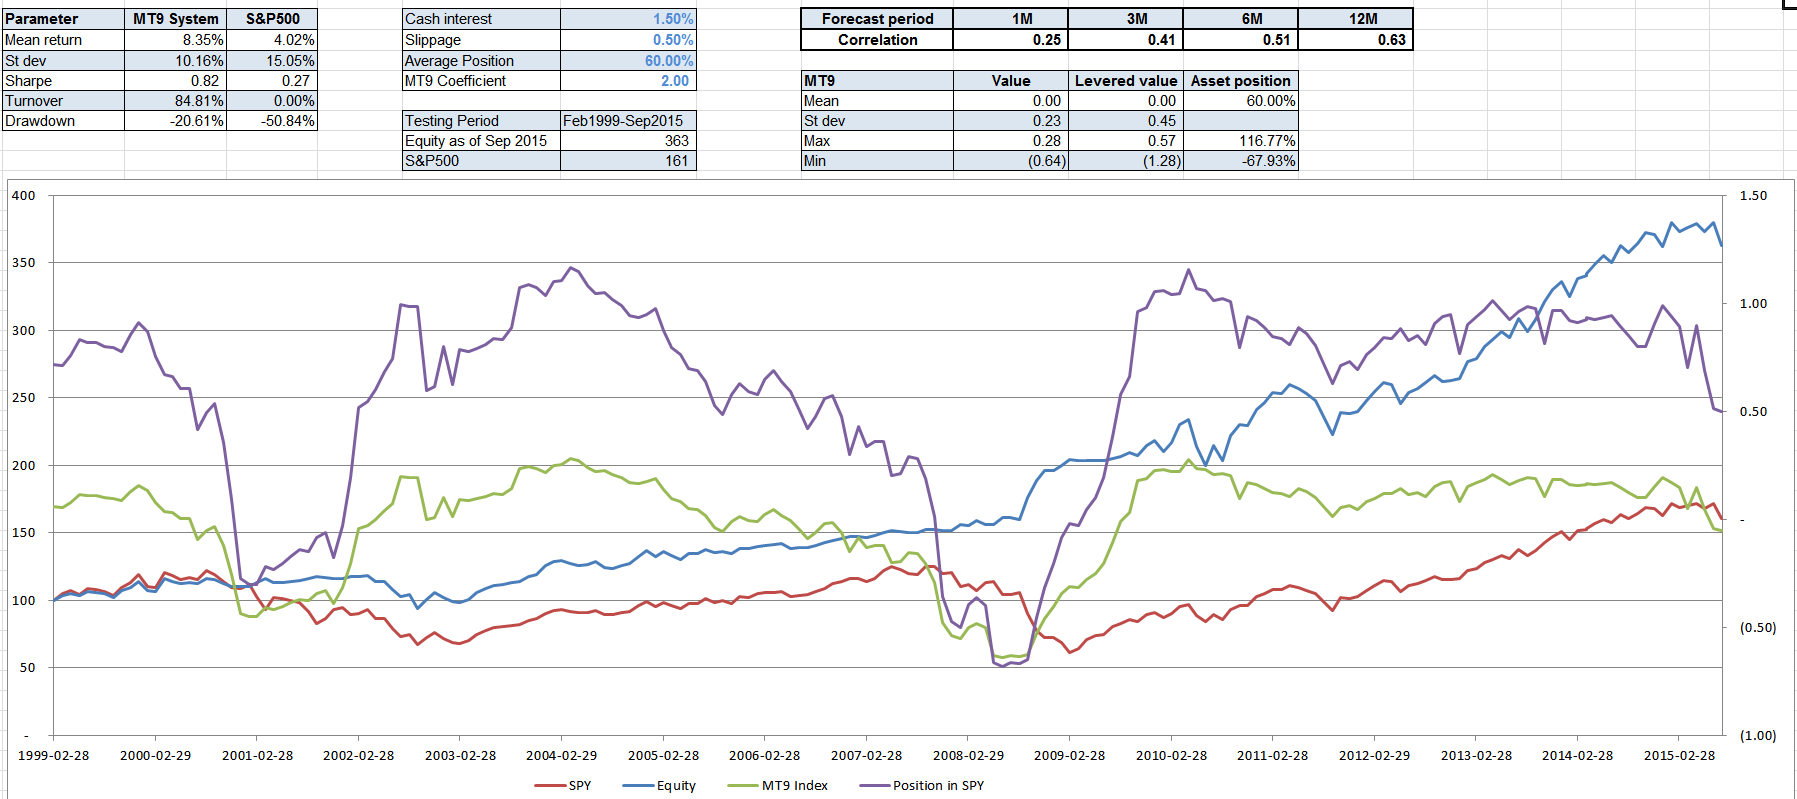
We already considered Hull’s paper approach to market timing models. I think it is the most logical and powerful approach.
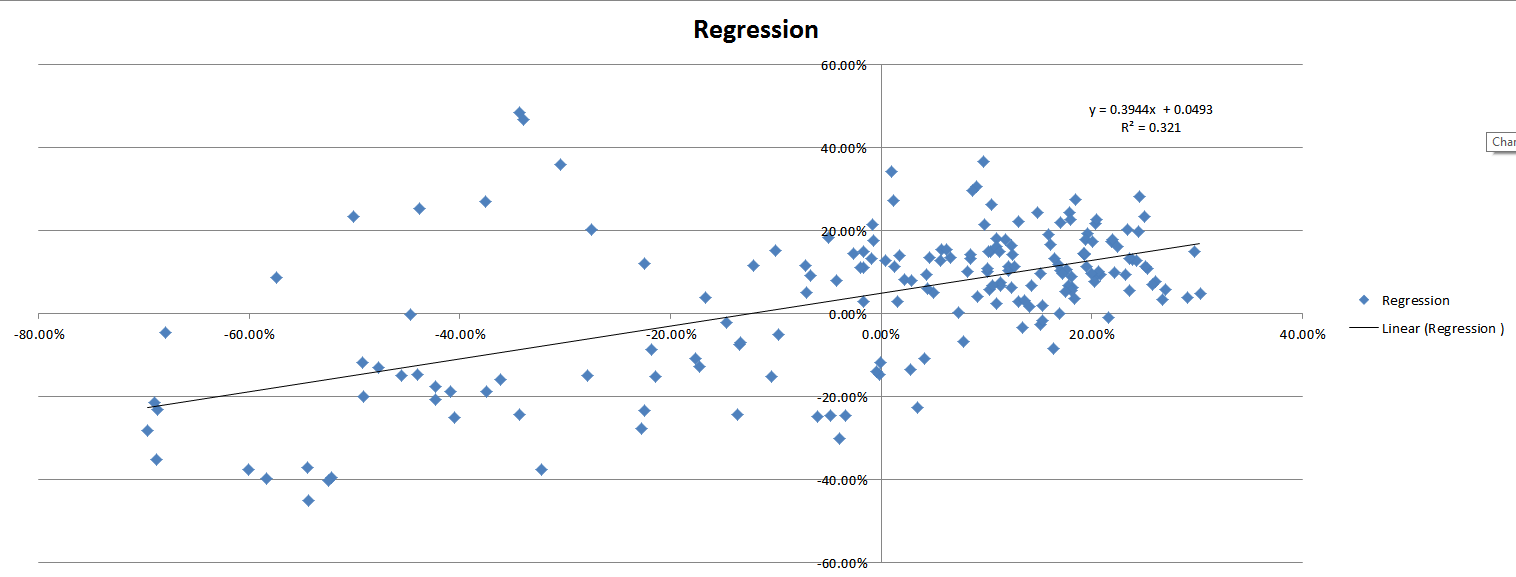
We take macro factor universe (let’s say 20 different factors). Construct linear function on it. Then we optimize it’s coefficients (factor’s weights)
to get maximum correlation for our objective linear function to future 3M, 6M, 12M, 2 years average market return (SPY for example) based on shifted time frames (10 years for example).
Every week we update it. So ok. It shows 0.5 correlation to 6M and 0.7 for 12M, for example. The less forecasting period the less correlation and forecasting power, but higher potential annual return (cause we can buy and sell 4 times during a year based on 3M model and make profit maybe bigger than based on more reliable 12M model but trading only once a year). Based on that objective function and it’s current correlation you can choose the way use it in your trading in practice (I wrote about it).
Second, stock specific movements.
We use the same approach. We have bigger stock factor universe (let’s say 100 in P123 for example) and 4000 thousands tradable stocks.
Then we construct the same linear objective function with that factors. Choose forecasting times periods (assume 2 weeks, 1M, 3M, 6M).
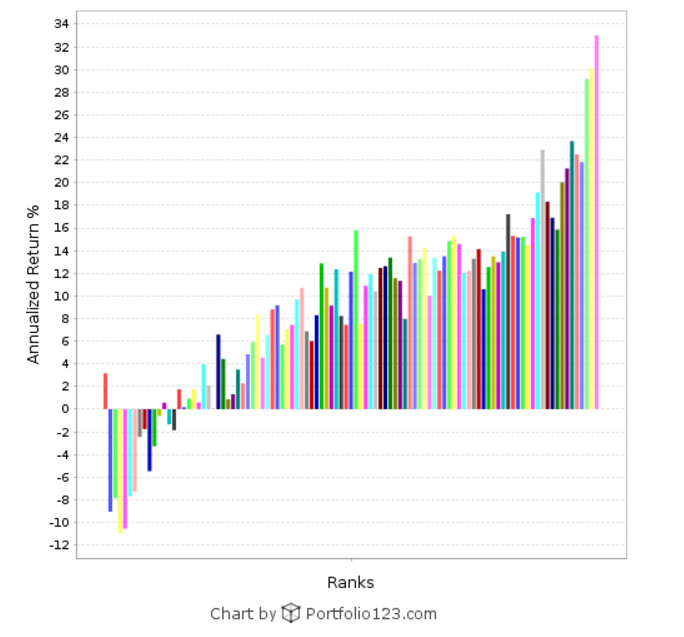
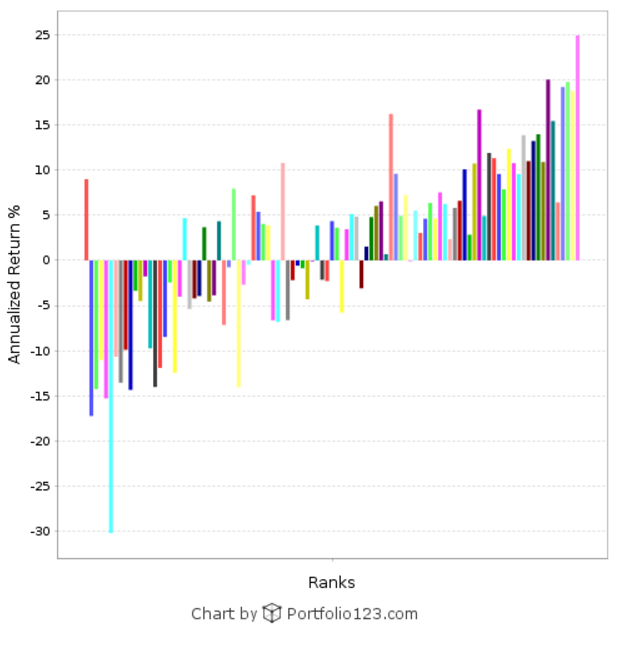
Optimize it to get maximum correlation to future stock return based not on 16 years (as popular in P123) but on less periods, let’s say market cycle period 5-7 years. When we get objective function for each stock we averaged it weights based on sector or industry allocation (find average weights within market sector in order to avoid over-fitting).
When we get averaged function we screen our stock universe for the highest current correlation. Then we rank screened stocks by highest objective function value for long positions and lowest for short. Then we buy/short some portion of it (up and bottom part) based on our liquidity requirements. Then we exit position when stock drops from correlation screen/rank and objective function rank.
Further, we can combine our MT and specific model into one objective function that shows us what to do at any time and market conditions.
Right now we make our stock specific objective function manually (ranking system) and can observe visually only rank correlation to stocks ret on average period of time then stocks lie into specific rank (rank performance graph shows rank - ret distribution on variable time frame inserted by user but based only on forecasting period that equals to average time when stocks remain in specific rank). We can’t calculate exact correlation value for our rank to separate stocks or it’s combination. And that’s the main problem.
We choose highest rank (ranked objective function) to buy but we don’t know how reliable it is. More often than not it has high rank but low predicting power due to low correlation in current conditions (and maybe in any conditions due to extreme fitting in ranking development on 5 stocks port models). That’s why the most models don’t work OOS.