Cremers of Yale/Notre Dame has written several papers that conclude managers with “high active share” vs their benchmark outperform the “closet indexers.”
Active share is just a measure of how different your portfolio is (in terms of what it includes, what it excludes, and the weightings) than the bench.
he identifies that among high active share managers, those with the lowest turnover and longest holding periods perform the best.
Further, Petajisto at Blackrock has written that among high active share managers, those with the lowest tracking error (i.e. those who are not making huge sector bets) perform better than those high active share managers who tend to concentrate heavily in a one or more sectors.
No one running simulations on Portfolio123 has any problem with active share. There are no closet indexers here.
However, what are your thoughts on lowering tracking error vs the bench? Who are the members here that have led the charge on this issue? Do people actually use the SecWeight and IndWeight features to limit concentration?
Likewise, what are your thoughts on lowering turnover and increasing duration of holdings? Who are the members here that have led the charge on this issue? Do people actually run annual screens and simulations that are annually rebalanced? What other steps do people take to lower turnover if they rebalance more frequently.
Thanks, I look forward to participating in a lively discussion.
Thanks for sharing. Mutual funds are quite limited in their outperformance. The best mutual funds should be able to make 2% a year more than the market. 2% a year adds up to huge amounts over time, but in any given period the manager risks looking like a fool because there is always some degree of unpredictability. Therefore, once a fund has assets they are sitting pretty making lots of money and don’t want to rock the boat. They also get too big to invest a meaningful amount in any investment. That may be why the game is rigged against picking out-performers.
While a fund manager cannot afford to be different, an investor can afford to be different if he knows that his system works. There are R2Gs that can be realistically expected to beat the market by more than 10% a year over time. That’s very very huge. I am obviously biased to favor my own systems but mine are not the only ones. If we had to limit sector concentration then it would be difficult to do nearly as well. For diversification I combine a few models that use different approaches. For even more diversification I use a different asset class altogether such as quality bonds.
Still, I do limit my concentration away from specific sectors that have shown themselves to be unpredictable and volatile such as energy and financials. (BTW, financials are now so cheap compared to the market that in my private ports I do incorporate them now. In my R2Gs I do not want to take the risk of another 2011.)
I don’t know why the mutual funds that were “sector bettors” didn’t do as well. I am in the process of reading the article.
While the individual investor does have a lot more room to manuever than a major mutual fund manager, and while Buffett has proven that beating the market by ~15% a year can be done over the long haul, my guess is that many (not all) of the Portfolio123 systems beating the market by at least 10% annualized SINCE LAUNCH either:
Suffer a lot of volatility/beta, or
Are limited to less than 10 stocks, or
Invest mainly in small and microcap stocks, or
Don’t have a very long track record, etc.
What would be really interesting is a 20-30 stock portfolio of highly liquid large caps that could generate 10% of ALPHA per year after launch. My sense is this would require a long term value approach married with a good hedging strategy for times of crazy market volatility.
For my personal portfolio I don’t worry too much about volatility if I have lots of confidence in the system. Besides instead of diversifying with one system picking many stocks I prefer three systems with a handful of stocks each.
How do I get confidence in a system? That’s the billion dollar question. By the time you get a long track record it’s often too late. Instead I settle for a short track record that is consistent with the backtest plus factors that are known to work plus a design approach that is know to work.
[quote]
What would be really interesting is a 20-30 stock portfolio of highly liquid large caps that could generate 10% of ALPHA per year after launch. My sense is this would require a long term value approach married with a good hedging strategy for times of crazy market volatility.
[/quote]I (and quite a few other designers) could create such a system building on research that we did already. Yet, I don’t expect much demand because the backtest won’t be as pretty as some of the R2Gs and because it will have streaks of under-performance when subs would bail out.
Off the top of my head hedging strategies come in four flavors and each one has advantages and disadvantages. None of them are good enough to fully rely on.
High quality bonds. This is a tried and proven method. The disadvantage is that it can drag on returns unless you use leverage. Also, there is still a 5% chance or so that bonds go down at the same time as stocks (judging from the past century or so of data) albeit not by a lot.
Moving average rules. As a value guy, I hate to admit this and it took a lot of data to convince me but these strategies reduce risk during major crashes. It stands to reason. The market doesn’t plummet from 10,000 to 0 in one second; it takes time. This creates a trend that is picked up on. The disadvantage of these strategies is that they can drive people bananas during routine corrections.
Sector switching. This type of system can work but it is really hard to know how well each individual system will do in the future.
Economic signals such as plummeting earnings and earnings estimates and rising unemployment. I prefer to use a composite fundamental indicator which will flip the hedge on during a serious economic crisis. The disadvantage is that may miss some smaller corrections and may not turn off the hedge until the market has already recovered somewhat.
Trend following systems such as CTAs. Very reluctantly I have to concede that the data seems be in favor of this. I don’t know enough about this type of system.
Coincidentally, I was just reading a paper today from AQR, which suggests that relying solely on active share may not be the best way to evaluate ex-ante performance:
I’m willing to go after higher turnover, concentrated strategies, but these have limited capacity, at least in my experience (I’m sure others have had more success). I find that lower tracking error (i.e., higher Information Ratio) strategies are easier to develop for large portfolios, and also easier to follow. There’s probably some limit to how much “bad” tracking error one is willing to endure.
I still use weekly rebalancing, but for my lower turnover strategies, I use SecWeight to diversify, lower the rank to sell, and use ranking systems that have slower-moving signals. For example, any ranking system with high weights to momentum or sentiment would most likely have relatively high turnover.
But, I like to be agnostic and not exclude any specific sector or market cap.
Bonds work great as a hedge when stocks and bonds are both in bull markets (falling interest rates). At some point (and the million dollar question is when), bonds will enter a multiyear bear market.
I personally believe that bonds will act once again as safety play as the stock market bull which started in 2009 transitions into a bear market. But after that, I suspect bonds won’t be nearly as good a hedge as recent history suggests.
S&P 500 only
Rebalanced once a year
Simple - uses a couple of ranking systems and a couple of stock factors to whittle down the universe to a more manageable size.
Then it applies a ranking system and selects the Top 25 stocks.
Any stock not ranked in the Top 25 the following year gets sold and must wait a year to get back in.
Finally, sector exposure is limited to ensure diversification.
I tested it several times by using Random > 0.5 as the second variable after Universe (thereby cutting the available stocks in half) and it still outperformed (by not as much obviously).
I tested it over several starting dates and it always generated good Alpha.
Even though this Sim could handle a $250M hedge fund, there’s probably no demand for this kind of Sim on P123.
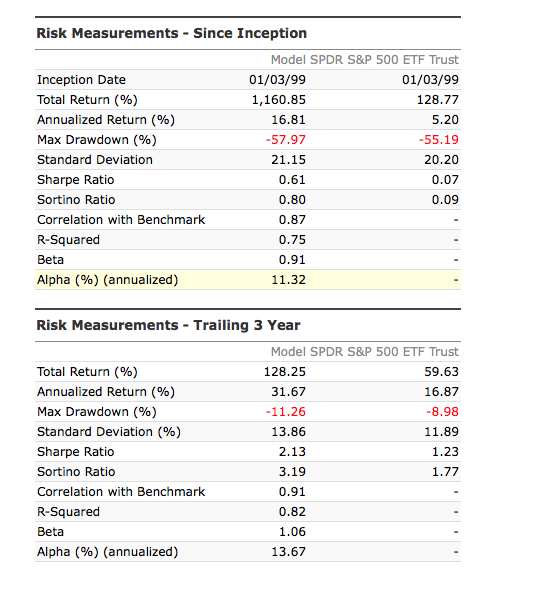
The main reason that your above Sim would not receive much support is that with the 58% drawdown it takes 5.6 years at a 16.81 annual return rate to recover from the 58% loss. That is why many of us strive to preserve capital during recessions.
My approach is to use many uncorrelated Ports that follow different system approaches and that all use some form of market timing or hedging. that way during a recession they gradually move from equities to cash, inverse ETFs, and/or bonds, then gradually move back into equities as the recession fades.
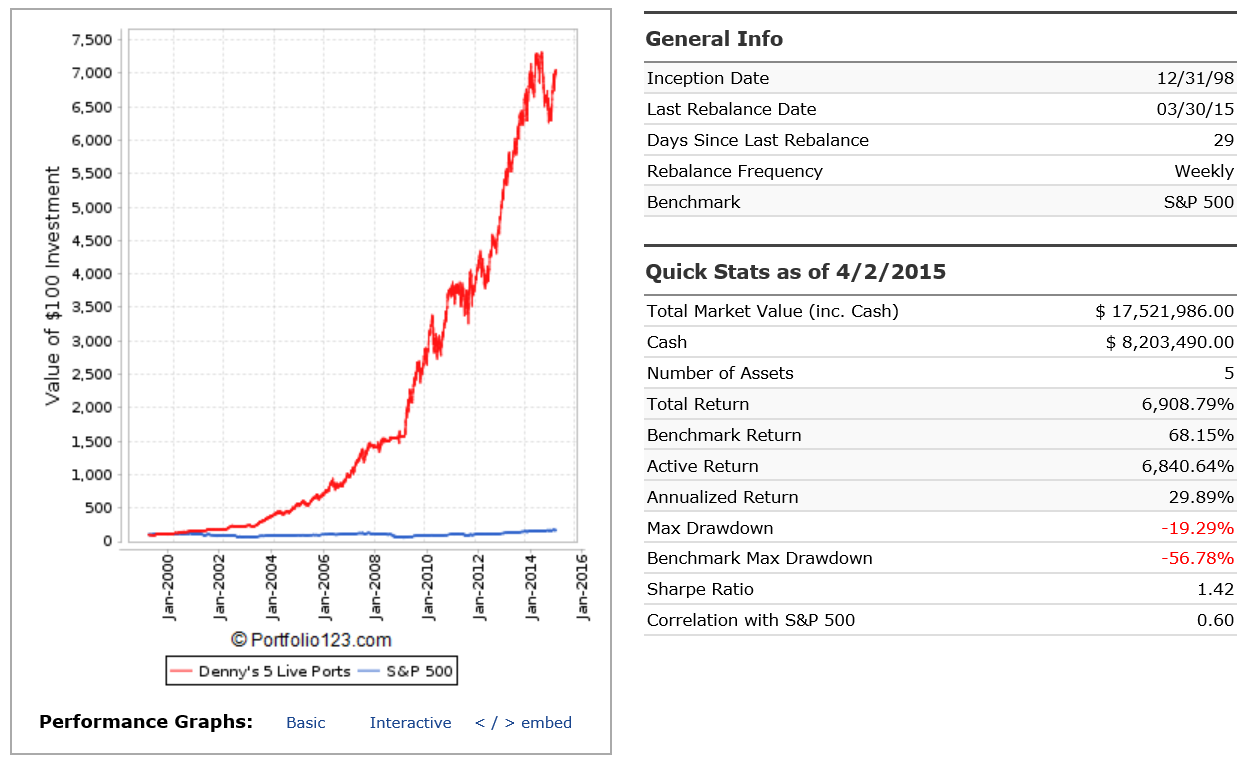
I have found that even if you want to stay in the S&P 500 with 25 stocks, it is much easier to achieve a higher annual return with much lower drawdown using five uncorrelated 5 stock Ports than a single diversified 25 stock Port. See below:
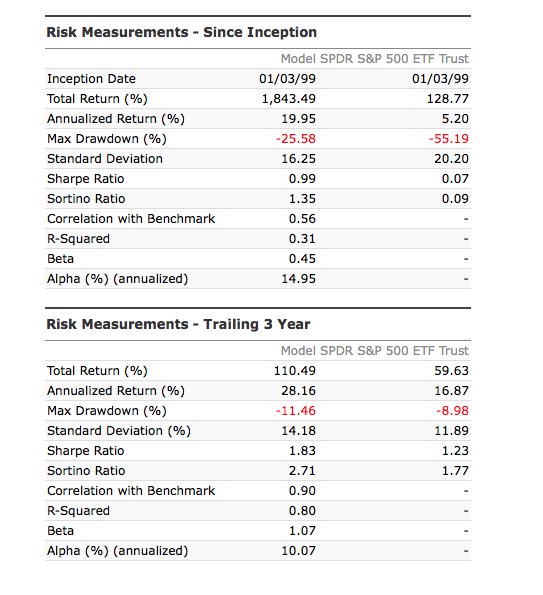
I would never suggest anyone sit through a 58% drawdown. However, it’s impossible to hedge an annual P123 port mechanically with any precision. See below.
Regarding 5X5 or 1X25, I understand the power of blending noncorrelated ports. However, I also agree with Olikea that 5- and 10-stock ports aren’t nearly as robust as larger ports when it comes to translating backtest success into live success. I have seen way too many 5-10 stock ports look great in backtesting and perform horribly live.
So with 5x5 you not only do you have to worry about whether the 5-stock port was curve fit to past data, you have to worry about whether the past correlation between ports will hold up in the future.
Just my 2 cents. I posted the research above because it’s so different from how many people approach things on P123.
BTW - I changed my port to weekly and added tax-based sell rules that sell losers at 360 days but sell winners at 367+ days when they fall out of the Top 25. This allowed me to put on Marco’s earnings/trend hedge. Drawdown using this crude hedge was reduced to 25%.
That’s a nice Sim, easy to trade and tax efficient.
Consider this approach (which is what I did above with 5 live Ports). Take your 5 favorite 20 or 25 stock Sims (the more uncorrelated the better). Since the original Sims were all well designed with minimum data mining, they will individually all have good performance and will be robust (or they wouldn’t be your favorite Sims right?).
Convert the original 5 Sims to 5 stock Sims. Now the 5 stock versions will be selecting stocks from the highest 1/4th or 1/5th of the ranks that the original Sim’s stocks were selected from. Those 5 higher ranked stocks will, on average, out perform the lower 3/4th or 4/5th ranked stock that the original 5 Sims bought. Therefor, everything else being equal, the new 5 stock Sims will have higher annual return than the original Sims did, but with a higher standard deviation and worse drawdowns, but that doesn’t matter.
Now add the 5 stocks Sims together in a Book. The new Book Simulation will have a significantly higher annual return than the Book of the original 5 Sims and most likely have a lower Standard Deviation and max drawdown than any of the original 5 Sims.
If you need to trade more than 25 stocks add some more uncorrelated 5 stock Sims. I currently trade 11 live Ports.
My bottom line is, after you develop your best robust 10 to 50 stock uncorrelated robust systems, when you are through, and think you have good ones, convert them to 5 stock Sims and add then to a Book. It will be very unlikely that if you design systems using that approach to not result in an improvement in annual return, max drawdown, overall robustness, and out of sample performance of your overall Portfolio.
PS: the 5 Ports that I used in my example above were all created from Sims between April 2009 and July 2013 and have been running on automatic rebalance since they were created. So the results are out of sample from that time. The 14% drawdown in the second half of 2014 was due to energy stocks that were held in 3 of the 5 Ports.
PSS: Olikea does have four 5 stock R2G Ports so he must think that they have some merit or he wouldn’t offer them.
Do you use SecWeight or IndWeight in your 5-stock Sims in compiling your Book? Or do you let the chips fall where they may on sector concetration (the overweight energy example in 2014)?
I do use Sector and/or Industry weight in many of my Ports. I took the time to check the 5 Ports above and found that 3 of the 5 Ports had sector weight buy rules. Of the 5 Ports, 2 didn’t trade any energy stocks during the Summer & Fall of 2014. The other 3 Ports averaged holding ~5 energy stocks during that time (not necessarily the same 5 stocks for the full time).
So in effect, the 5 stocks out of 25 total in the Book is similar to a single 25 stock port using a SecWeight < 20 buy rule in the Port. The energy stocks that the 3 ports held had an effect of more than a 50% drawdown for the energy sector held by the Book. So the 14% drawdown in the Book was due to a 10% drawdown due to the energy stocks (5/25 * 50%) plus an additional 4% drawdown due to the rest of the overall market during that time frame.
I think this is a matter of preference and personal style.
I found it easier to achieve consistency with multi-factor portfolios and a relatively large number of holdings (at least 20). In fact, when I tested my models with 5 holdings, the performance tended to deteriorate. If diversification and consistency can also be achieved with a large number of 5-stock portfolios, then great.
he identifies that among high active share managers, those with the lowest turnover and longest holding periods perform the best.
Further, Petajisto at Blackrock has written that among high active share managers, those with the lowest tracking error (i.e. those who are not making huge sector bets) perform better than those high active share managers who tend to concentrate heavily in a one or more sectors.
[/quote]Parker,
I just got around to reading Petajisto’s paper. His analysis was very high quality. Still, there might be room to disagree with his conclusion. First, I will try to summarize some highlights. Then I will try to present Petajisto’s conclusions. Then I will try to theorize alternate conclusions.
Paper highlights
As Parker pointed out, Petajisto found that among funds with high “active share” (i.e. funds that had positions that were the most different from the benchmark) those with low “tracking error” (which he called “stock pickers”) did better than those with high “tracking error” (which he called concentrated funds). Tracking error is measured by calculating the standard deviation (i.e. the volatility) of the fund minus the standard deviation of the index.
Petajisto’s conclusions
Tracking error measures sector bets.
It’s best to be sector neutral.
Alternate theories
I have seen many tens of thousands of different experiments on P123. I have rarely seen that explicitly limiting the sector concentration improved results. This leads me to believe that there may be other reasons for the improved performance of low tracking error funds.
Tracking error is simply a measure of volatility. Perhaps the “low tracking error” funds simply invested in less volatile stocks and took advantage of the low volatility premium?
The high tracking error group includes a group of funds that tends to hold large chunks of cash such as Sequoia, Weitz etc. Perhaps cash held back returns.
Funds that bet explicitly on sectors often do so for macro reasons. Macro is notoriously difficult to predict. Perhaps the “high tracking error” group contained a disproportionate number of macro funds which skewed the results?
Actually, tracking error is the standard deviation of excess returns. The formula in the statement above would result in a drastically different metric. See link below:
I don’t believe this is a correct conclusion, due to a misunderstanding of what tracking error measures. In fact, low-volatility strategies tend to have higher tracking error than traditional strategies, which generally try to maximize Information Ratio since this is a often a key metric monitored by institutional investors. Conversely, low-volatility strategies focus on Sharpe, as opposed to Information Ratios.
My interpretation of the paper’s results are that active share is a reasonable measure of stock selection, while tracking error is a reasonable measure of factor bets (e.g., market timing, sector or country bets, value or momentum). And the study suggests that historically, it has been easier to outperform (net of fees) utilizing security selection, as opposed to factor bets.
As I mentioned in my earlier post, there are at least some folks who disagree with the study’s conclusions that active share is a predictor of outperformance, after controlling for benchmarks (see link below).
Thanks for the correction. Similar to what you pointed out from Wikipedia, Petajisto’s paper defines tracking error as the standard deviation of the daily relative returns (i.e. relative to the index) of the fund for the six months preceding each holdings report date. Still, why does it disprove theory number 3?
To sum up some of Petajisto data in the 2013 paper:
Active share by itself was a mixed predictor of fund outperformance (inferred from table 5).
High active share + Low tracking error did correctly predict future outperformance to a degree (table 5).
When prior year relative strength (relative to the index) of a fund is added to the mix it improved returns even further (table 7).
See also this 2014 paper by Cremers showing that among high active share funds, those with low turnovers (defined as less than 50% a year) were the only subset that outperformed. If you would draw a parallel to P123 then you would come to the conclusion that it does not pay to have a high turnover P123 strategy. Yet, that has not been my experience. My high turnover private strategy has made 50% annualized over the past five years post inception with paper money and 50% over the past six month with real money (and 70% in sample). My conclusion is that the criteria for picking a good mutual fund is not necessarily the same as the criteria for designing a good strategy in p123. We can theorize why.
P.S. In table five of Petajisto’s 2013 paper in table five he controls for four factor alpha. Does anyone else find that controlling for the four factor model seems specious? What’s wrong if a fund uses the four factor model to pick stocks; doesn’t it work?
One must also keep in mind that Petajisto’s paper studied professional fund performance, while P123 strategies do not have the same considerations or constraints that might affect a fund manager. Though it would be interesting to conduct a similar study using R2G strategies, including all deactivated strategies in the graveyard. I would be curious to see how active share and tracking error correlate to out-of-sample performance. We’d probably need to wait until there is enough data to draw any conclusions with any statistical significance.
I just read the AQR paper that you provided. Thank you, it is very interesting! My investing knowledge has increased exponentially like a hockey stick since joining P123 thanks to people like you.
AQR makes the case that there is no theoretical justification given for active share, and if in fact there would be some advantage in being different than the index, why would high “tracking error” not also be a predictor of future outperformance?
In the AQR paper they make the case that a sort on active share is a sort on benchmark type. Funds that have small cap benchmarks have high active share and vice versa. Once you adjust for the benchmark there is no statistically significant outperformance of high active share.
They make the case that there is no theoretical justification that being different than the benchmark should predict outperformance (vs. underperformance).
However, should anyone profile managers who outperform their benchmarks over the long term, the vast majority of them will have high active share.
Further, AQR wholly failed to address the other conclusion from Cremers: that high active share PLUS low turnover is predictive of outperformance. Cremers never said high active share alone was predictive of anything.
As a firm, AQR believes in factor betting. So it’s ironic that they fail to address the fact that their benchmark adjusted data in Table 3 shows factor bets performed the absolute worst of any of Petijisto’s five categories.
To your point, high tracking error is associated with inconsistency in returns (i.e. high volatility). The higher the volatility (the greater the inconsistency), the less predictive a strategy becomes.
That’s inaccurate. Exhibit 1 clearly shows that the lowest quartile of the large cap managers were all above the 60% threshold for high active share as defined by Cremers. It’s more accurate to say that small cap managers usually have higher active share than large cap managers.