I have spent last 18 months with p123 without prior experience on quant systems,
and was inspired by community forum knowledge to stay with p123 and keep learning.
Some experts says run your simulation with all 16 years of data, which has 2 bear markets and correct way of evaluating trading systems with all market conditions.
Recently, some experts suggest to revise systems based on what works now (every 6 months!).
I have good simulations for last 6 years data, since Nov 2008, all time invested without market timing,
but some time, i am hesitating to pull the trigger, because, my simulation is performed on only 6 years of data (which has only one long bull market) with variable slippage.
Please, suggest me, which is best approach 6 years simulation or 16 years simulation?
Can keep following this 6 years simulation till S&P 500 turn down more than 20% and and go to cash thereafter?
I believe longer time frames are better. Sometimes one must resist the temptation to go with “what works now” as this may lead to overfitting. “What works now” really means what has worked in the recent past, versus what has worked over a longer time frame. Neither approach necessarily translates to “what will work in the future.”
Kumar-
I have lots of simulations that work well in from 2009 to the present, but lose money from 2000-2003 and 2007-2009. I wouldn’t put money in a model that did well in the last six years, but had not been tested otherwise.
-Bob
Kumar - what I do is optimize from 2007 onward then I will test from 2000-2006 to see how that period looks. 90% of the time the earlier time period will test good. The reason I optimize my systems from 2007 onward is because I generally get unsatisfactory results if I optimize over 2000-present. By “unsatisfactory” I mean that the optimization process will generally give overachieving results from 2000-2006 and substandard results from 2007 onward. Sometimes you will get 300%-400% return for 2003. Is that important to you? That previous time period is not where I want superior performance, certainly not at the expense of more recent times.
Dear Kumar,
when designing a portfolio I find it helpful to first test the system from Oct 2007 (S&P 500 peak) onwards. By doing this, the subsequent downturn and crash is being fully reflected and adequate factors (e.g. in a ranking system) are selected that worked well during that time. Interestingly, such a model tends to work quite well when being tested out-of-sample in a simulation of 1999-2007. However, the risk of over-optimization for what has worked well during 1999-2003 is far lower.
By all means use the full 16 years of data available to test your model. Then I would look at the following:
how is the performance of the model in the last couple of years compared to the early 2000s? You might notice that many R2Gs have a phenomenal performance during 1999-2003, but a much poorer in recent years - for me not a very promising sign for future performance;
how steady is the capital curve and excess return over the last 16 years? A good model will show consistent outperformance and an almost straight performance line when plotted on logarithmic scale. A good example herefor is Aurelien’s Aggressive Value R2G which currently has a 99 points rank in terms of out-of-sample performance.
Don’t let these so-called ‘experts’ lead you astray or rattle your resolve. Someone who suggests they have a secret formula might actually be hosting an infomercial - No “Sham Wow’s”, thank you very much. It’s not impossible to earn tripple digit annualized returns year over year using equity investments… it’s just really, really hard for an average Joe. 25-30% annualized returns? Now we’re talking! Those are achievable, repeatable and scalable; and not just with micro-cap stocks. And at those numbers, you’ll be growing wealth many times faster than the rest of the investing universe. I’ve recently read an article on Forbes that states the average investors earns less than 3% annualized over the last 10 years and less than 2% over the last 30 years. Here’s a link .
As for your simulation, as others have suggested, use the full capability of P123 and run a full test - it’s going to give you a better chance of knowing how the portfolio will perform in the future than a shorter run. Even better, test it to start each of the past 16 years on 1/1 and consider how it performes with different starting dates. It doesn’t cost you anything more to do additional testing, asside from your time.
Lastly, if you have a port that you think could be successful, run it with a small percentage of your tradable dollars… perhaps 10%. Let it run for a while and then you’ll know. Run it along side your more traditonal value portfolio’s and perhaps a bond portfolio and rebalance once per year. There’s no indication from your post that you plan on running this as your only portfolio, make it one of many. If it’s got a low correlation to your other ports I say go for it. Start incrementally and evaluate at the next rebalance period. If you feel comfortable it’s performing as expected, rebalance some of your winnings in or out and let it run another year.
Kumar/Chris - There is no problem with testing over 16 years, or testing year-by-year for that matter. But don’t dwell on the early years as fundamental data availability was just starting to emerge and the pickings were easy. My point has to do with system development/optimization. Put the priority on 2007-present. Once you have optimized your system then you can test it any which way you choose.
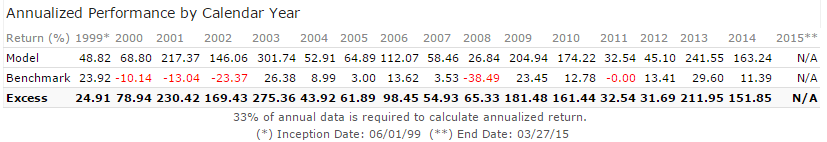
Thank you for your ideas to run simulation with 16 of years data and give importance to 2007-2014 performance.
I am working on to get 4 5 stocks portfolio to build diversified 20 stocks holdings, using weekly re-balancing with avg holding of 30 days.
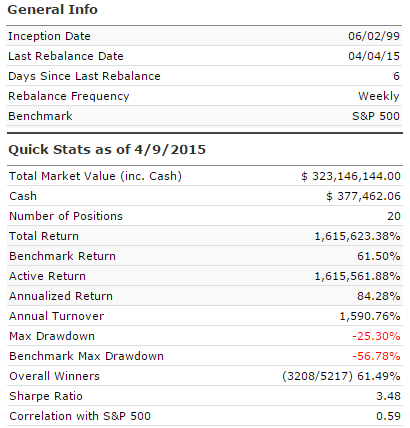
Now, it is run with 16 years of data with slippage. without changing any rule.
Nice looking results kumar! If you have not already, it is always good to do some sensitivity testinmg such as:
size: try different portfolio sizes to see how much the results vary, 10 stocks, 20 stocks, 30 stocks… Ideally you would not want to see a big change in returns.
-Liquidity: what are the minimum liquidity parameters that you have used? try increasinmg liquidity and see how results change as well.
slippage: if you have used variable slippage I think that is generally conservative, if you have used fixed slippage, check the impact of changing slippage, which will basically depend on your average return per trade, if its small then the impact of slippage can be big and viceversa.
When you start using it, monitor slippage so that you can check if you are having similar results as you simulated.
So far, i become good with fundamental and quant systems,
keep working on gain knowledge with momentum and technicals (to become good with when to buy and when to sell).
There is any good book recommendations on swing trading & technicals which supports quant systems ?
Appreciate your helps.
This attachment is sell all stocks on weekly rebalance,
no sell rule, long only, 20 stocks holdings, no slippage.
Nice model. Thanks for providing inspiration to continue my search over the weekend do you mind posting the trading snapshot - just curious about the liquidity and holding period.
In yahoo commentary, expert said, if market is 20% down from recent high, the market will turn into bear market most of the time.
For me, the below timer is working well in simulation to stay away from Sept 2008 to March 2009.
Buy Rule: (BenchClose(0) / highest(#bench,63,0) > 0.80) and (BenchClose(0) / highest(#bench,126,0) > 0.80)
Any one can try in your simulation and comment about this timer based on s&p500 price decline 20% from recent 3 months and 6 months high.
Kumar - down 20% is the definition of a bear market. Whether this has any true meaning or some Wall Street journalist wanting something to write about, well… I’m not sure. In 2011 the stock market was down 19.8%. Good thing it didn’t go down another 0.2% or investors would have been in big trouble
Steve
I have only one book on technical analysis: “New Concepts in Technical Trading Systems” by J. Welles Wilder Jr. If willing to put in the time, I believe it could yield excellent results. I, unfortunatly, haven’t mustered enough mental fortitude to get through the entire thing. It is less a ‘book’ and more of a ‘workbook.’ Wilder takes you through his calculations step by step. The book predates modern computers. Data is presented in spreadsheet form, calculations and graphs are hand-drawn. Original subject matter was intended for futures, currency and commodity traders.
As for your results from above… If I understand you correctly, you’re selling all stocks each week? It seems you’re turnover rate should be higher if that’s the case.
Thank you for the technical book recommendation, I will go thru.
It is selling all the stocks every week; and buying back sold stocks if it is in top rank and qualify buy rule; buy back is not counted in turnover.
mmasand,
I used to grasp the number of days holding based on annual turn over.
|====================================================|
|Avg Holding days | Annual Turn Over | Number of time all the stocks sold per year |
|====================================================|
|365 | 100% |1 time |
|36.5 | 1000% |10 times |
|3.65 | 10,000% |100 times |
|====================================================|
|20 to 22 days | 1600% |16 times |
|====================================================|
Experts,
Please, help to recommend books for swing trading and mean revision strategies.