I’ve spent a fair amount of time trying to figure out what factors are important in a Ranking System. To that end, I’ve run the Rank System optimizer. My methodology has been to create a matrix with as many rows as columns (plus the original weights) and simply zero out one factor at a time. Like this:
3 0 3 3 3
1 1 0 1 1
4 4 4 0 4
6 6 6 6 0
Examining the optimization, I could then see which factors, when removed, hurt the performance (ergo, they were valuable to the model). This even helped me to adjust the rank system weights (just because the removal of a factor hurt the model does not necessarily mean it should be completely removed; perhaps you should just reduce the weight).
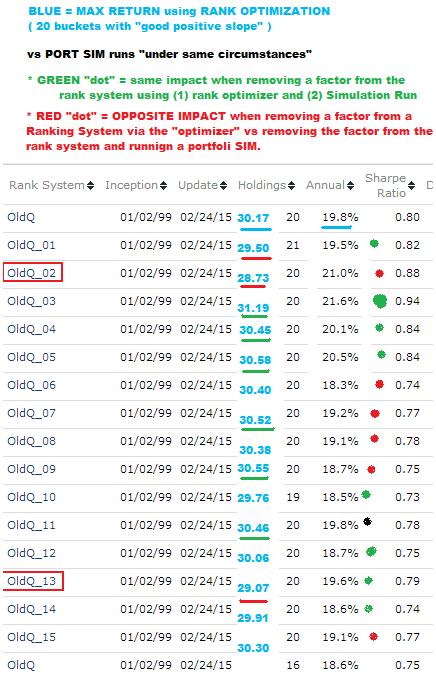
I ASS-U-MEd this was helpful, but for the first time ever, I just ran Simulations based on these different ranking systems and the results were disappointing (see pic). I used a 15 factor model and, in theory, I would think the consequences of removal should be consistent between Simulations and Ranking System performance (via optimization). They were NOT.
About half the time, the impact was opposite. That is, if removing a factor hurt the performance of the rank system, running a simulation on that ranking system actually improved the performance(relative to the base systems). I denote this as a “red dot” (6 of them, vs 8 “green dots”, which mean the performance change agreed under both systems - 1 seems indeterminate). I even put the two performance number columns into an excel spreadsheet and found a weak 0.05 correlation.
Just so you understand, take “OldQ_02” as an example. When I removed it in the Ranking system optimization, the performance declined to 28.73% from the base case of 30.17%. Conversely, running a simulation using this “degraded” ranking system saw the simulation portfolio INCREASE to 21.0% for the base case of 19.8%.
It appears the only real way to test is to run simulations instead of optimizations of ranking systems.
Miles
Not at all surprised: I’ve ranted many times against the practice of refining one’s predictions of the past, uh, I mean optimization.
But even beyond that, there’s another problem. I think the role of ranking systems – any ranking system, even the best most well constructed ranking systems – in generating real-money performance is very much over-rated in forum discussion. Reliance on a ranking system is as effective as a sales person prospecting by calling names in order from the white pages. He can get lucky here and there, but that’s a heck of a way to try to make a good living. On the other hand, a sales person who prospects from a well-constructed and possibly expensive-to-obtain list of per-qualified prospects, that’s an entirely different and much more promising scenario.
To make P123 work with real money, you can catch lightning in a bottle with a ranking system, but the probabilities in your favor rise dramatically if the system picks from a well-constructed per-qualified list; i.e., a good screen or a good set of buy/sell rules. With the models I use for real-money investing, my portfolio tends to outperform the top bucket in a test of the ranking system alone.
P.S. Frankly, to me, the variations in performance tests among the ranking-system variation listed in the image look insignificant. Not sure if you did any statistical tests on the significance of the variations, but regardless of what they showed or would show, there’s no way I’d invest a nickel based on an assumption that any one is better than any other.
Hello OldQuant,
This would mean there are major bugs in the ranking/sim of P123.
If all settings are equal in the rank performance test RPT and in the Sim , then both should show the same results.
With equal settings I mean:
sim and RPT are run on the same universe
sim and RPT have same time period
sim has not got any buy and sell rules (except only sell rule rank<90 or 95 or 99 etc…)
sim and RPT have same fixed slippage of 0%
number of holdings in sim is the same as the number of stocks in the top bucket of the rank
sim and RPT have same rebalancing interval
Sim Max Weight Deviation 10 (should be 0, but unfortunately it is not selectable)
…
With all settings being equal, the sim does nothing else, than holding the stocks that are in the top bucket of the RPT.
So the results have to be the same.
I also had a few instances, where I thought that the sim and the RPT showed different results.
Then I double checked the test settings and finaly found my mistake.
I suppose you do not want to share your sim and rank system from your post, so I could try and verify your results.
Perhaps you have got a different rank that shows different sim and RPT results, which you could share with me.
Then I could verify the test results and we could escalate this to marco.
If you are right in your post, then this would be a major bug, that marco has to fix.
Thanks,
Toby
Have you tried varying the number of positions in your sim? I would have thought that using more positions in the sim would make the sim results closer to the ranking system results because of the sample size.
As an aside I’m left wondering what exactly Marc means by “good” or “well-constructed” when it comes to a screen or a buy or sell rule. Is this something that has some sensible-sounding rationale behind it, and therefore ought to work? Or is it something deduced from back testing? I suspect its the former. Yet there are plenty of sensible sounding filter rules for stocks that simply don’t work, just as Efficient Markets Theory says they shouldn’t. Doesn’t that leave us with back-testing? Isn’t that what P123 is all about?
Watch the Universe selection. The rank performance tool doesn’t support filtering prior to ranking, so Universes like ‘All - Fundamentals’ will contain some low liquidity stocks. Are you testing against a custom Universe?
Walter