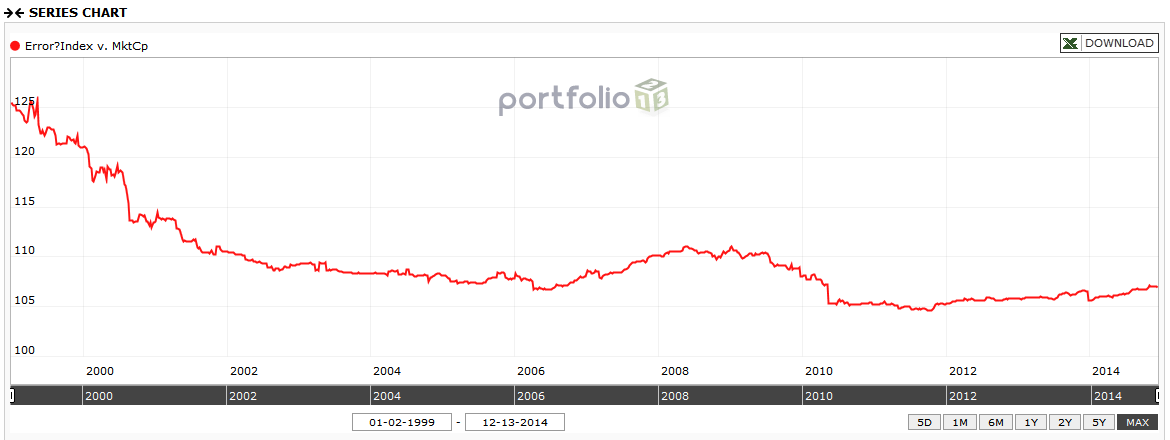
This series is simply the ratio of the S&P 500 Index / the combined market cap of all stocks in the S&P 500. I would think that the chart should show a straight line with possibly some spikes due to outliers in the SharesQ data. But the chart trends down for the most part. Is this supposed to happen? What am I missing? The Series is public and is here. Thanks.
Chaim,
As you make clear, the formula should reduce to 1/SharesQ.
If this is a true graph of 1/SharesQ (without running any numbers yet), it strongly supports the recent discussions that stock prices are just supply and demand. Did you make this point in one of your posts? Of course, this is affected by money supply, allocation to stock vs. bonds etc. Ken Fisher in his books tries to boil it all down to supply and demand for stocks. If forget who put up the link (will look) but this is the recurring point here
Chipper,
Initially, it seems to me to be an “error”, too. But, one thing I can guess is that the SP500 Universe composition on P123 is not 100% aligned (both in terms of stocks and dates of additions and subtractions) in real time with the actual SP500 stocks. P123 may have a lag here, or may be using some approximation or formula to estimate SP500 stocks.
If you chart just the market cap weighted index, it’s ‘roughly’ the same as the SP500 - so the approximation isn’t bad, but it’s not perfect. So, my bet is it comes down to the underlying stocks in the universe and when they enter.
If you change the ‘rebalance frequency’ to daily, also see that it’s ‘more off’ when volatility is highest, but it’s pretty close after 2001 or so. So, likely some data issues here. Not sure why the volatility would affect the drift? But likely some different stocks in here.
P.S. If you change the graph so that the benchmark is the SP500 ETF with dividends, you get a very different result (the inverse) of this result.
Best,
Tom
Absolutely not. S&P uses float-adjusted market capitalization, which is price multiplied by the number of shares they determine to be in the float based on their own proprietary work in which some large non-insider blocks may or may not be counted in float based on S&P’s determination of how likely the shares are to be put on the market, something that can at times be estimated from public filings but which at other times may require directly contacting and discussing with the holders.
As an S&P licensee (Compustat, our fundamental data source, is an S&P subsidiary), we are given actual index data, not just now but historically. And as you can see from the difference between market cap as we know it and float-adjusted market cap as S&P determines it, indexing is a very complex business and the providers take their intellectual property very seriously. While publicly disclosed methodology documents (here’s the one for S&P: http://www.spindices.com/documents/methodologies/methodology-sp-us-indices.pdf) can give us a sense of what they are doing, do not expect that you will be able to replicate, verify, or audit the actual figures. The best you can do is approximate (assuming you study the documentation). That’s why we present PRussell benchmarks instead of Russell benchmarks. We don’t have a Russell license, so we can’t give you all the exact info. The best we can do is create an algorithm that calculates a Portfolio123 approximation of the Russell indexes (hence the P at the beginning).
Umm…if I’m understanding the problem correctly, the S&P 500 is float weighted, not market-cap weighted. Try substituting “100FloatPrice” for MktCap and you’ll get something that looks generally better. Float data is unreliably spotty prior to July 2004, so that part is way ugly, but it otherwise hovers in the 1.1 to 1.2 range. As I recall, the institutional ownership figures may be delayed in the feed that we get from S&P, so this probably explains why it’s not a straight line.
By the way, we might have used some sort of criteria-based workaround back in the Reuters days, but we now license the S&P 500 directly from S&P, so you can pretty much expect that it will be point-in-time.
Even under the best of conditions, use of our float data won’t work. The major index providers like SP and MSCI calculate float in their own proprietary ways that often require direct communication with holders of large non-insider blocks to assess the likelihood the blocks will be offered in whole or in part in the market any time soon. They don’t aim to be anywhere close to the sort of float figures that can be calculated from public filings.
So, as someone that reads a lot and probably does not really get most of it:
Is the float really changing and are some of the changes in price that we see in the S&P 500 indeed related changes in the supply? I mean, if this is a true reflection of the float (however they calculate it), a pretty good argument could be made that the crashes in the stock market occur when there is a large supply (as reflected by the float) and the recoveries are at least correlated to decreasing supply.
Thanks for your help already.
Yes, the float and the supply of shares in general is going to be reflected in the stock price. However, I’m not at all sure that the overall float is related to the market cycle, except as a concurrent symptom.
That is, the institutional owners see a truck coming and get out of the way. By selling to the general market – or “suckers” in this context – they increase the overall float. After the truck has barreled into the crowd, they then pick up the bargains lying around and reduce the float again. Yes, that might – heck, probably does – amplify things, but the trigger is still the institutions getting out of the way for other reasons. And would a change in the float be actionable by we suckers?
I would argue that the answer is no. As Marc references above, there’s an entire business called “share/stock intelligence”, if I’m remembering right, that makes big bucks tracking who owns large blocks of shares. That data is both labor intensive and closely held. (Read: Expensive.) The data that we have is not that data, but is instead picked up from SEC forms. Hedge funds, who most certainly can hold large blocks of shares, in particular don’t really need to report anything to the SEC as long as they are careful to stay under 10% of total ownership. Share intelligence will catch that, the SEC forms will not.
But there may be something to the float, sure. The 100FloatPrice series appeared to consistently be 10% to 20% under the S&P Index. How much of that is indicative and how much is delayed or inadequate information, I don’t know. I didn’t even notice if there’s a pattern. You’re welcome to look at it and see if it’s useful.
As I understand it, the S&P changed to float-weighted in 2006, before that it was MktCap weighted.
Steve
Thank you everyone.
It’s really the additions and subtractions from the index that will throw you off. These affect the index shares. In order to derive index shares, you could do the following:
[Index Shares] = [Total Float] / [Price]
For a 99.9% accurate methodology to calculate the S&P 500 Index, please see my custom series: https://www.portfolio123.com/app/screen/summary/493?st=1&mt=8
You have to export the series to a spreadsheet and then calculate the compounded return to derive the index’s total return from a given point in time.