Can we predict DOW sell-off ahead of time (1 week earlier) ?

Mgerstein/Denny/Dwpeters/Steve/Tomyani/Judgetrade,

Here, screen shot is for reference,
i have 5+ years experience in share market, would like to get input from experts, how reliable this technical signal is to stay side-way for a while.

There is any way to predict the market top, using market timing rules or when big guys are moving away from market ?

There is any way to include the this strategies in P123 systems ?

I would like to stay away from market before market turn down using timing rules and come back when buying opportunities present after market oversold by manually.

Please, advice these technical signals are trusworthy atleast for dow and nasdaq main market indexes ?

Thanks
Kumar


Hi Kumar,

Your question is one that has been asked by millions. I know of no way to definitively determine future inflection points. However, there are ways to identify tendencies of the market to change direction at certain points so that you can increase the probability of buying low and selling high. Systematically improving entries and exits, combined with carefully crafted stock selections, is the approach that I have sought to master with the model portfolios in my value-based newsletter for the last 10+ years.

Using MACD as a technical indicator is not a good choice in my opinion. The MACD is based on moving averages. Moving averages, by definition, are based on historical prices. Historical prices are not good predictors of future prices, and moving average crossovers are very, very slow indicators. Their capacity to confirm a change in direction is high, but their ability to predict change of direction is weak. In my experience, you also can get a lot of false signals with MACD. In general, I stay away from moving averages (and MACD) as entry/exit signals. In addition, MACD is an unbounded indicator, so there is no way for it to identify overbought or oversold conditions, which are key in finding entry/exit points.

The Money Flow Index (MFI) you have identified is the better choice as a predictive indicator. The MFI is an oscillator that uses both price and volume to measure buying and selling pressure, so it is frequently referred to as a ‘volume-weighted Relative Strength Index (RSI).’ Many theories suggest that volume leads prices. Since RSI is a momentum oscillator that already anticipates prices, incorporating volume using the MFI indicator can theoretically increase this lead time, so it has potential.

Unfortunately, MFI is not a technical indicator that is currently available in P123. I would support a feature request to add it as I would love to test MFI here, but it would probably be far down on a long list of projects that Marco has in front of him.

You are on the right track in incorporating an oscillator for your entry/exit decisions. Oscillators are the best way to identify overbought and oversold conditions, which are the times that an equity is ripe for a change of direction. For Intelligentvalue.com we combine a customized oscillator, support and resistance trend lines, and a secret formula in our Intelligent Market Timing Model, which we use to make market-risk-related exposure decisions for our two portfolios.

Our Market Timing Model is set up for longer-term investing with individual stock holding periods of 4-6 months, and over the last 10 years it has been refined to the point that it is very effective in reducing drawdowns and optimizing entry points. You can take a look at an example of our system at this link. We do an analysis of the Russell 2000 index and the Russell 1000 index each week, but the system can also be applied to the DOW, S&P500, NASDAQ or any other index. If this is something similar to what you’re looking for, I’ll be glad to answer questions and help you out in any way I can. Just send me a message or post your question here. Good luck.

Kumar - I’ve never really been a fan of drawing trend lines on indicators while looking for divergences. The reason being that the concept is somewhat artificial. The indicator is a compressed version of the original signal and there will naturally be a divergence whether one is warranted or not. You also need to be wary of using a graph as an assessment tool. Very often I have found something that looks like it really works on a graph. But when I go through the calculations for each buy sell price, I find that the strategy is either marginal or a loser.

There is one strategy that I like however (see the attached graph). I marked up your chart by drawing trend lines underneath the price action. You need two short term “valleys” to draw the trend line. When the price falls through the trend line then you get out and wait for a new entry signal. The point marked (A) did not have two valleys to draw a trend line underneath so it would be considered a false breakout. The problem with this approach is that you give up a lot on entry, waiting for two valleys to be formed. But if you have a different entry mechanism then it might work pretty good.

Steve

** EDIT **
I should mention that P123 has On Balance Volume (OBV) that is not an oscillator and therefore might be useful for divergences. There is a function OBV slope that could be used for determination of divergence. I have never been able to get much predictive power out of it though.


Trying to time this kind of “sell offs” is like trying to box with mike Tyson in his best year (he was unbeatable!), I at least have no edge over
hedge funds and HFTs with market data and connections we only can dream of and that specialice on these small movements (even they often can not do it).

By defintion: this was not a sell of to me at all. This is absolutly normal volatility and I believe we had low vola the last couple of years
and it should go up, we have a blazing bull market and bull markets tend to squeze out weak hands by heavy vola.
To sum it up: A sell of for me is a drop of ca. 30% over some months or days.

I stick to what I can: specialice in niches where I have a competetive advantage (= Small Account).
and only trying to avoid mdds > 30-40 percent.

I tried otherwise for years, it was a waste of time!

Regards

Andreas

I basically agree with Judgetrade on this. Trying to call short-term market tops is likely to be a big-time losing proposition. Most future traders can’t do it over 5 year cycles. Those that do trade baskets of lots of systems that include short-term momentum, short-term mean reversion, etc. You can most easily control risk through:

a) asset allocation (hold some cash and short term or medium term bonds - and run some large cap as well as small cap systems).
b) dynamic hedging overlays. Pick your factors. MA’s, spiking volatility, falling SP earnings. Create systems for each, and then add them so you are getting more hedged as the market falls apart. These may reduce long-term returns, but will also likely keep you out of huge 50% plus DD’s.
c) If you really believe in your factors and their long-term alpha, hedge against the broad index at some static level (say 20% short to start). This can smooth out returns.

The best way to measure the usefulness of any signal like this may be to subject it to what I’ll refer to as the Motley Fool test, since it’s based on a challenge they once issued, or reportedly issued (there’s lots of urban legend in the investment community) to practitioners of technical analysis.

  1. Have a friend or colleague create a bunch of price chart printouts – make sure you don;t see any of them.

  2. Have him tear each sheet in half (vertically, so the early part of the price action is on one half and the latter portion is on the other).

  3. Then, have him give you a half sheet showing only the early price action.

  4. You predict what comes next.

  5. Look at the other half to see if you were right.

  6. Repeat for each example.

(According to the legend, all of the TA experts who were asked to participate in this exercise refused.)

If you’re happy with your predictions, then you’ve got a winning approach. If not, oh well . . . .

If you want a short term forecast for oil or gold, I have an alternative system, one that backtests exceptionally well: Ask me to look at the chart and tell you what i think the next move will be. Then, you trade in the opposite direction. So far, with oil or gold, I’ve been wrong 100% of the time. :slight_smile:

Seriously, though, with stocks – and I know a lot of people here are really going to HATE to hear this – assuming you are unwilling to simply stay long and ride it out, the best way to predict the short term is to pay attention to what’s going on and apply some educated judgment (and by “educated,” I mean a serious effort to learn the whys and wherefores of short term moves – learning not so much how different events should impact stocks but how the investment community as a whole thinks, rightly or wrongly, they’ll impact stocks) and monitor carefully so you can reverse quickly if you start to see reason to believe you’re assumption was wrong. Even economic data, which I hope might hold the key to market forecasting over and intermediate term, isa unlikely to do much for the short term because of reporting cycles and lags.

BTW, the suggestion to use judgment is not a fancy brush off. I mean it. Each and every meaningful chart event is caused by something. Contrary to what some of a prior generation of academicians would have you believe, nothing is random. (The so-called iconic “random walk” is more like an instance of IUI – Investing Under the Influence . . ." The reasons might be sound. The reasons might be silly. The reasons may be so obvious even a 20-something CNBC junior producer who graduated two weeks ago with a communications degree can recognize them. The reasons may be so hard to ferret out, even seasoned pros may have to roll up their sleeves and dig. Either way, there are always reasons and and short-term timing is a matter of identifying and understand reasons either in a top-down way (the way most of us have to do it) or a bottom up way (i.e. the way traders with access to deeper level bids and asks and a grapevine use that to note who is bidding and who is offering at what levels and with what degrees of determination). Charts such as you show might not be predictive per se, but they might be great at helping establish the general outline for the story you’d develop as you ferret out reasons, and even in giving you a sense of the kinds of things for which you should be looking. (You’ve identified money going in and money going out, but you need to flesh it out with the reasons.)

Tom,

Are you adding the below components into 1 timing system or using separate timing systems based on the factors below integrated into a book (to stagger your entries and exits)

" dynamic hedging overlays. Pick your factors. MA’s, spiking volatility, falling SP earnings. Create systems for each, and then add them so you are getting more hedged as the market falls apart."

Marc,

I agree that using judgement can be very effective. However for one to successfully do this they need experience, emotional control, ability to filter the noise, as well as the confidence and guts to go against the herd or override quantitative signals when needed. This is a rare combination of attributes.

All,

I bet that nearly all timing systems that were out of the market missed this 2 day 4.5% move. This is one data point illustrating the difficulty in timing short term moves.

Scott

Thank you all for the responses to my questions.

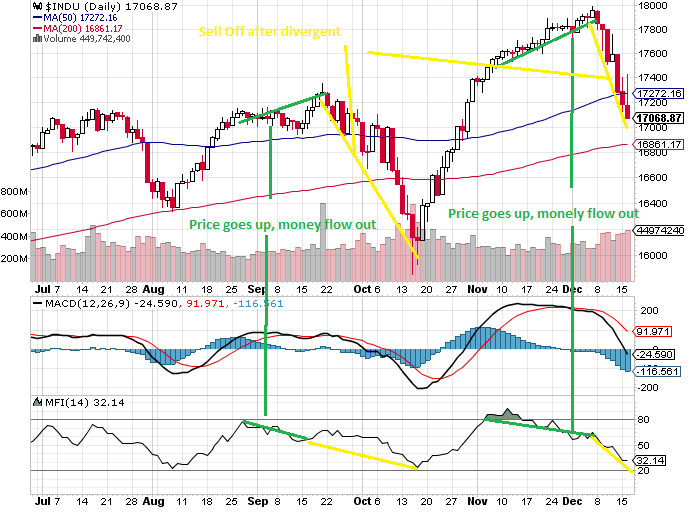
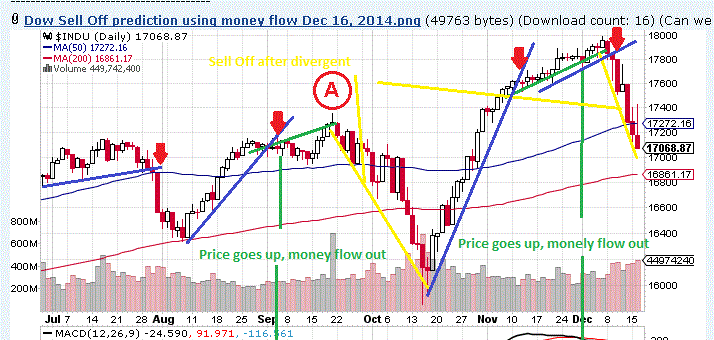
Now, I understand the investors should not panic about 5%-10% DOW main market sell-off, it is normal. It happends for last 2 years, eventually the market bounced back very stronger.

mgerstein,

Now, I do have another question when the market sell-off like 16th Dec 2014, 5% discount from recent high (DOW 17050 from 18000), as the 3/4 of market follows main indexes, the yahoo commentary experts says, it is a great buying opportunities.

But, I don’t know what to buy using portfolio123 tool.

In case of Zack Rank, AAPL - 1 (Strong Buy), BRK.B- 2 (Buy), BBY -2(Buy), WU-2 (Buy).

In R2G the fundamental strategy worked better than small cap and trader strategy in out of sample. (Small cap strategy has liquidity limitations and slippage, etc.,)
Only, handful of R2G strategies beats S&P500 since R2G launch.

Believe, Basic user will benefit from experts, if there is portfolio123 subscriber only feature; special rankings for largecaps(may be 100 well known symbols).
Simple interface to run favourite company symbols to find buying opportunty and holding for 3 months, 6 months & 12 months

With these, well known and all time favourite stocks
BRK.B, AAPL, GOOGL, AMZN, JPM, HD, BBY, HPQ Just buy and hold strategy might double the money in 2 to 3 years .
I believe, this is far better than any R2G strategy in safetly wise and just buy, hold and watch.

I am looking for this kind of group stock recommendations to hold for next 3 months / 6 months / 1 year features from www.portfolio123.com weekly FUTURE stock performance holdings email along with Weekly past performance simulation;

==========================================================.
Note:

  1. I have subscribed to IntelligentInvestment news letter (it promised 100% returns every year and it strictly follows quant and portfolio123 tools to select stocks);
    My bad luck, It is in negative returns since March 2014 (for last 9 months), i unsubscribed few months ago.

  2. Earlier this year, I have subscribed to 3 of the Picklehead trading systems, all of them lost money, around 20+%.

  3. Built own simulation for micro and small cap with help of Denny’s guidance,
    it returns 200%+ per year (after slippage and commission) for last 2 years on market open,
    (Believe, you people notice on weekly performance e-mail , my name is on yearly performance rows)

    a. mentally not prepared to trade this system, because of quant systems failures on Note 1. & 2.

    b. I am in full-time job, i can’t watch the small cap falling down or climbing up daily basis,

    c. can’t watch and buy for better slippage during market open, no edge to minimize slippage. small caps strategy success depends on slippage.
    ===========================================================

After being 1 year with portfolio123, and reading thru forum, i understand
You people have nearly 30+ years real investment experience (steve,denny,mgerstein,olikea,amiran,twytwy,tomyani,dwpeters,judgetrade,scott and many other experts) and have minimum 5 to 11 years experience using portfolio123.

Please, suggest basic user can directly benefit from www.portfolio123.com ?

  1. Without prior vast successful investment experience and
  2. just using simulation knowledge and
  3. investing time on weekly basis and only buying and selling stocks on Monday near market open.

Thanks
Kumar

Kumar,
When you say :1. I have subscribed to IntelligentInvestment news letter (it promised 100% returns every year and it strictly follows quant and portfolio123 tools to select stocks);
My bad luck, It is in negative returns since March 2014 (for last 9 months), i unsubscribed few months ago.
Are you talking about Christopher Michaels newsletter at IntelligentValue.com ?

jbarnh,

yes. please, read thru http://www.intelligentvalue.com/14-free/content/imtm/141129.htm

Thanks
Kumar

Kumar - you ask how you can benefit from using Portfolio123. I assume by “benefit” you mean make more money than you could by buying mutual funds. There are a range of benefits and that is just one. Another benefit might be to learn how to invest in a safe manner and be able to sleep at night. Or gain more experience with the markets.

It strikes me that you are attracted by the promise of extraordinary triple-digit profits every year. I think this is the first problem that you need to address as this is fools gold. I suggest keeping such high profit ventures small, perhaps to 10% of your overall investment capital. Trust me, I know this from experience as I am the world’s expert at losing more money faster than anyone else :slight_smile:

The remainder of your equity investments should be in more conservative higher liquidity stocks. I assume your main goal is to make money using third party models (as opposed to designing your own). I’m not sure where you get the idea that most largecap R2G systems make less money than the S&P500. There are quite a number of good models out there. I suggest choosing a number of models produced by different individuals. Also try to pick systems that are not in sync. i.e. Look for models with drawdowns during different periods of time. This provides the best diversification.

Steve

You’ve received some very good advise already. I would suggest to focus on a few things:

  1. Avoid chasing high returns. Most strategies achieve this only in backtest. The few that achieve such high returns in real time often revert to the mean and produce low returns going forward. So while real time results are better than backtested, they are still of little use in predicting future returns.

  2. Keep it simple. For market timing, things like moving average cross overs work very well at avoiding long bear markets. Diversification is a free lunch and should be part of every portfolio. For a P123 strategy, whether yours or an R2G, I believe that simpler strategies tend to be more robust.

  3. Costs matter. A number of studies have shown that low cost index funds outperform most other funds over the long term, simply because they have a lesser cost drag on performance. If you are trying to assess the value of an R2G strategy, I would suggest to give weight to the one factor that you can be sure of in the future: it’s cost. Any estimate of future performance is at best an educated guess. Also, costs need to be accounted for in a simulation. I think including variable slippage and real life commissions per share (eg. $0.005/share) does a reasonable job of this.

  4. Don’t reinvent the wheel. There are a number of good, public portfolio’s and simulations on P123. In building my first strategies I started out with making variations to those. I have several public portfolio’s that were copied or inspired by others, though I often used these for benchmarking and didn’t appropriately account for costs.

Don

Kumar,

First off, decide if you want to invest the time to really learn. P123 is, above all else, the MOST powerful learning tool around financial markets I have ever found. I have learned 1,000X what I learned in 4 years at a big-name b-school about how markets work. So, it’s an amazing tool and much better then business school for learning how to invest. But it takes time. Over 5 plus years, I have learned enough to completely revamp how I manage my portfolio. I have been able to replace almost all of my professional management. (I could replace them all, but still like trying to pick a high-flying manager here and there).

However:

  1. It’s not a get-rich-scheme (there’s no such thing in this world, except for the people selling them). Stop seeking one (if you are).
  2. The rewards will be proportional to a) the amount of time invested and b) the size of your portfolio. If your portfolio is small or your time is limited, you are likely better off focusing on your day job and using something like Wealthfront or one of the on -line low-cost / free asset management tools.
  3. Focus on risk management. It’s at least 60% of all long term returns.
  4. Beyond that, put X% in cash, X% in short (or mid term) US treasury bonds or a large number of very hi quality muni’s from your home state (also short duration), then build / pick one really good large cap and one really good small cap system. That’s all you need. Have 20 stocks in each, with at least 3-5 economic sectors and keep turnover low (for the first year or two at least, say under 200% / yr). Many people will disagree with me, but this is how I would start. Focus on ‘proven’ return drivers that also make sense and have been around for at least 10 years. Don’t spend more than 1% of the assets you will invest in a system on paying for an R2G.
  5. If you want, have one of the above 2 systems use market timing, or add an ETF rotation system or a dynamic hedge overlay.

You can find enough on P123 in the public domain to do the above and, I believe, outperform most professional managers and/or funds. But, if you don’t invest a decent amount of hours (hundreds at least), you are likely to make uninformed choices and likely are better off with a simple basket of 2 ETF’s - SPY and some local muni fund or short duration bond fund.

Good luck.
Best,
Tom

Steve,
When you say, “I’m not sure where you get the idea that most large cap R2G systems make less money than the S&P500. There are quite a number of good models out there. I suggest choosing a number of models produced by different individuals.” I am not sure I would agree. When I look at R2G and propose the following parameters :

  1. avg daily vol >500k not avgdailytot

  2. weekly rebalance

  3. at least 200 days since launch

  4. no timing or hedging

  5. no otc, adrs, or etf only
    I come up with a very short list that beats the S&P 500 buy and hold. If I restrict turnover to something reasonable and extend the launch period to say 400 days the list is shorter still.
    Your on it and here it is,

  6. Apha Max 10 large cap Shiguang

  7. Stitts Wealth Starter Stittsville
    3.Cherrypicking Blue Chips mgerstein

  8. Buffet mgerstein

  9. Fishing for the big one scmarsh

  10. Keating Ultra Defensive olikea
    There are some I might of missed but I checked 3 times. There are also some honorable mentions,

  11. Almost all of SZ’s ports but they are a 3 week rebalance . I emailed him about what a weekly rebalance would do to performance and he said it did not hardly affect it.

  12. Hemmerlings S&P 500 but he has market timing on the buy side it appears…

  13. Stitts market neutral and hemmerling market neutral if the ports never go market neutral. But then that would be changing the paramaters.
    Who knows how these that made the list would stack up against the index 5 years from now but I believe that list would be very, very, very short. Also Steve you are so right about Kumar is searching for too much return and easy knowledge. What I did here was not to criticize but to show how difficult it is to beat the averages. Just look at Denny Hawles at RTG or the majority of fund managers that can never get there… John

John - I don’t agree with all of your requirements, weekly rebalance is not important to me, as well as also no market timing/hedging. So I would add the following systems. And I’m sure there are more…

Keating’s 10 Large Cap Investor (S&P500)
Stitts Wealth Management - SP400+SP600 / LT TBonds
Best9(Russell1000)
SP500 Market Timed Hedge
Above-Average S&P 500 Picks
SZS Large Cap S&P Defensive II: Focused
Undervalued Blue Chip Stocks
S&P 500—Top Performers

A couple of these are fully subscribed but could easily sustain a lot more subscribers. So, including the ones you already identified, there are at least a dozen models to choose from. And don’t forget that we are drawing a line in the sand immediately after a drawdown. Wait a couple of weeks and I’m sure some more models will rebound from their current state.

There are also younger largecap models which are blazing a trail. I’m keeping an eye on them.

Steve

Steve,

I believe this is a great topic. But most of the ports you mentioned are market timed in some fashioned. This is a very shaky concept at best. Remember we did not even have market timing at P123 when I joined and now it seems we all take it for granted that it will work. That is still extremely uncertain. As far as weekly rebalance, at least one week should not skew results out of sample too much, But I have been personally been burnt big time with 6month and 1 year port results even if tested for robustness. In the end there just may not be enough trades in sample to be statistically relevant . RTG yet does not have enough OS to see and in a yearly backtest OS could take decades before it falls apart. Anybody trading these ports real time needs to be aware of the extra risk they are taking. In Olivers description of his Ultra Conservative he correctly points out all the pitfalls of the tricks. Timing . illiquid stocks lack of diversifications TA and indications that are data mined or curve fitted, short selling, short interest tec.
For me personally I beleive that the biggest failure and drawdown is always in front of us and if I get a less volatile product for a smaller return that may be worth it. Happy trading and investing. John

John - I agree when it comes to in-sample market timing. But that is not what we are talking about. As for 1 week versus 3 weeks, I don’t have a problem. But yes you do need to be more careful with how 1 Year ports are developed. It sounds to me as if you are doing a lot of generalizing where it may not be warranted.

Steve

John,

So, I did not hear any criticism of Keating’s Ultra Defensive Portfolio and it was on you original list. Open, liquid, with 20 holdings. You should just sign up. How many more do you need?

Jim, I am a subscriber to ultra conservative. However I also subscribe to SZ and Stitts market neutral. All have strong points and weaknesses. That’s what strategy diversification is about.

Steve, A lot can happen to a quant strategy in 3 weeks, Remember we are suppose to be following the signals without developing a brain or an emotion. The daily signal to reduce exposure could occurr the 1st day of that 3week period and we all know what happened in the 1st 3weeks of Sept, and October and November 2008. That being said, SZ answer to that is a good one. Mutual funds tend to rebalance at the end of the month so it is wise to rebalance ahead of them. Like I said I am a subscriber to SZ and to your Market neutral S&P. I do not expect any strategy to be perfect or without downfalls. I have been at this a long time with some success, but beating the index is tough and doing that with market timing is tougher OS over a long period. Maybe impossible. Maybe because no one can hang in there long enough to get that small extra edge a simple timing strategy might produce. Mebane Faber has talked about this at some length. Short term timing is a fools game . Really most investors should not be timing at all. Its a graveyard of broken dreams. okay enough said.

John

John - we seem to have deviated from the issue, that only a few R2G models have beaten the S&P 500. As I have pointed out, there are lots of models that have… After reading Kumar’s statement again, I believe that he is referring specifically to smallcap models, which have generally underperformed in 2014. Reading between the lines, he’s upset because he didn’t get the 100% gain per year that he was expecting. Actual results are quite different than the promise.

Steve