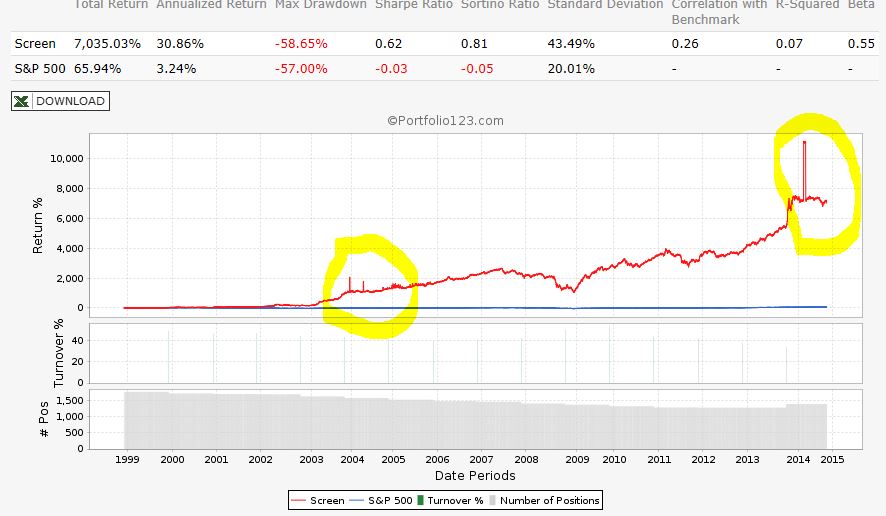
I’d be happy to show the results using the screener. I EV/EBIDTA this has been a valuable screen, but did not think it yielded >30% by itself over the last 15 years. Also, when I added this one metric to my other screen it hurt the results dramatically, so I thought there might be some error. There are three large peaks in the graph which may not be right…
I’m new to the site, so afraid something in the wording of the rule might be wrong.
If it is as I believe, your spikes are due to small cap stocks. A small company with a large reported cash position could have a very low EV/EBIDTA ratio.
Make this your first rule in the above screen and report back:
MktCap > 100
You should see the spikes go away but you will likely give up half of your return. Over the last fifteen years, small caps have been fetching increasingly high valuation multiples. Going forward, I don’t think small caps will outperform as much they since over the life of the P123 dataset.
As primus says, your results might be due to illiquid stocks passing your screen.
The easiest way to “fix” this, is to adjust the universe.
Go to the “Main Settings” tab in your screen and choose one of the more liquid indices, for example the S&P 500.
Judging from your number of stocks of your screenshot, you are currently running on “All Fundamentals - USA”.
Don’t give up so easily. Your rule “FRank(“EBITDATTM/EV”)>80” is nothing to sneeze at.
Even using the S&P 500 with your settings yields an annulized return of 13.24%
However, note that you would be trading 100 positions.
Now you could restrict your “portfolio” to 10 positions with “Max No. Stocks” in the “Main Settings”.
For simplicity, we assume you want to trade the 10 stocks with the highest “EBITDATTM/EV”-ratio every year.
So you use the “Ranking” “Quick Rank” and type in the formula “EBITDATTM/EV”.
Et voilà, the screen has become more managable in terms of positions and more profitable.
However, the max. drawdown is higher than the one of your benchmark.
Back to your original problem:
Members around here sometimes use these formulae to increase the liquidity/“tradability” for stocks to pass a screen/sim/port:
close - to exclude “Penny stocks”
AvgDailyTot - to make sure the stock is regularly traded at a reasonable volume
mktcap - to exclude companies that might be too small to have reliable data coverage
If you have not already, I would definitely read the Help->Tutorials on how to create Models in the Walk through Guide (How to Build a Model) as well as the A-Z Guide to Portfolio123. I would read those two before I even created my first model.