…showing negeative relative to nasdaq100 and sp500 Performance?
Big capital chasing big caps?
Opinions welcome!
Regards
Andreas
…showing negeative relative to nasdaq100 and sp500 Performance?
Big capital chasing big caps?
Opinions welcome!
Regards
Andreas
The answer is displayed in the chart below. The blue is the ratio of small caps / large caps total returns and the red is the % employment population ratio in the labor force. Whenever, employment is increasing, seems like the large companies are 1) better positioned to profit from economies of scale and 2) they tend to have a much stronger capacity to hire than small caps. Also, small caps tend to be domestic focused while large caps generate foreign revenue in a wider proportion. Therefore, small caps tend to outperform in the early economic cycle just as the Fed is easing or has eased by either lowering rates or doing the QEs which benefits the domestic more than the foreign. The domestic sectors are usually Discretionary, Financials, Industrials, etc. If you think of these assets as “boats”, small caps are “speed boats” while large caps are “cruise lines”, small caps can maneouver much better, therefore faster response time to a stimulus. In contrast, the Fed is kind of tightening at the moment, even if the rates are unchanged, lower QE is still perceived as a form of tightening. It looks like small caps are going to keep underperforming in the next months ahead.

The entire history of P123 with the small/micro cap focus has occurred during a prolonged period of strong relative excess performance by small caps over large. If you’ve only been trading since 2000 you’ve never experienced a capitalization shift. Just when you think you mastered the market environment, it changes.
Quantonomics - Interesting pic. Source? However, my first thought is “Correlation is not causation.”.
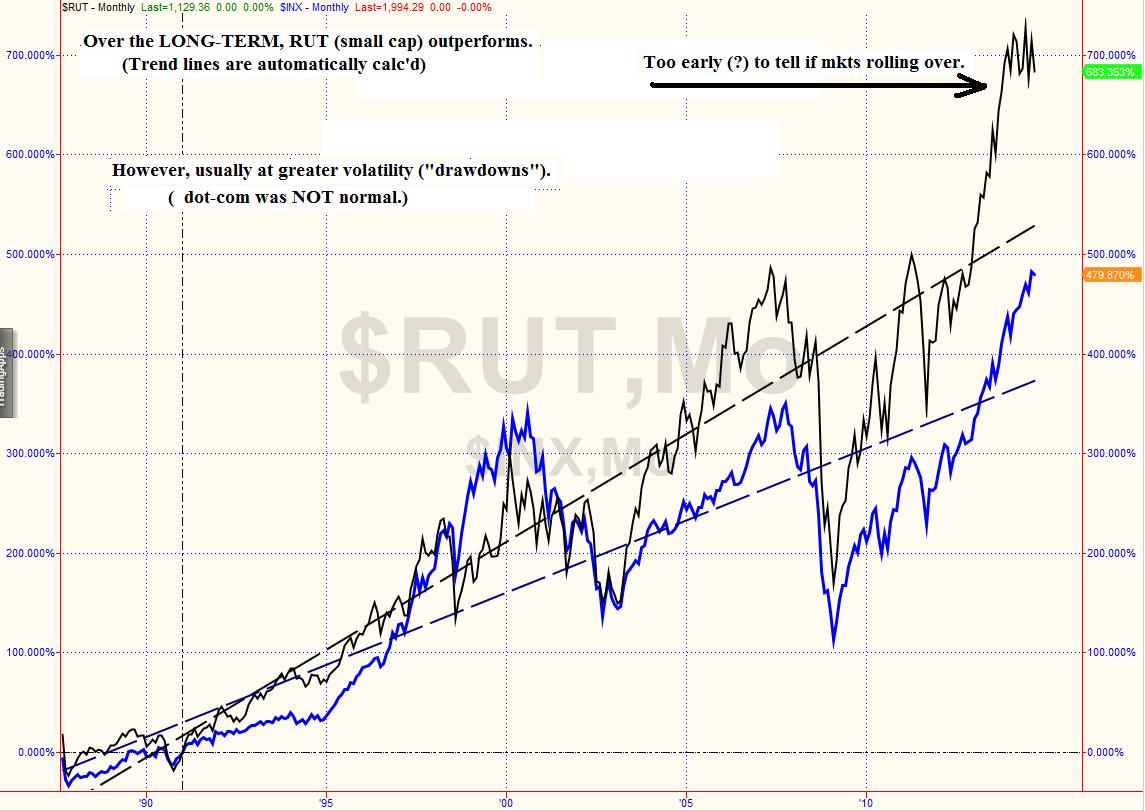
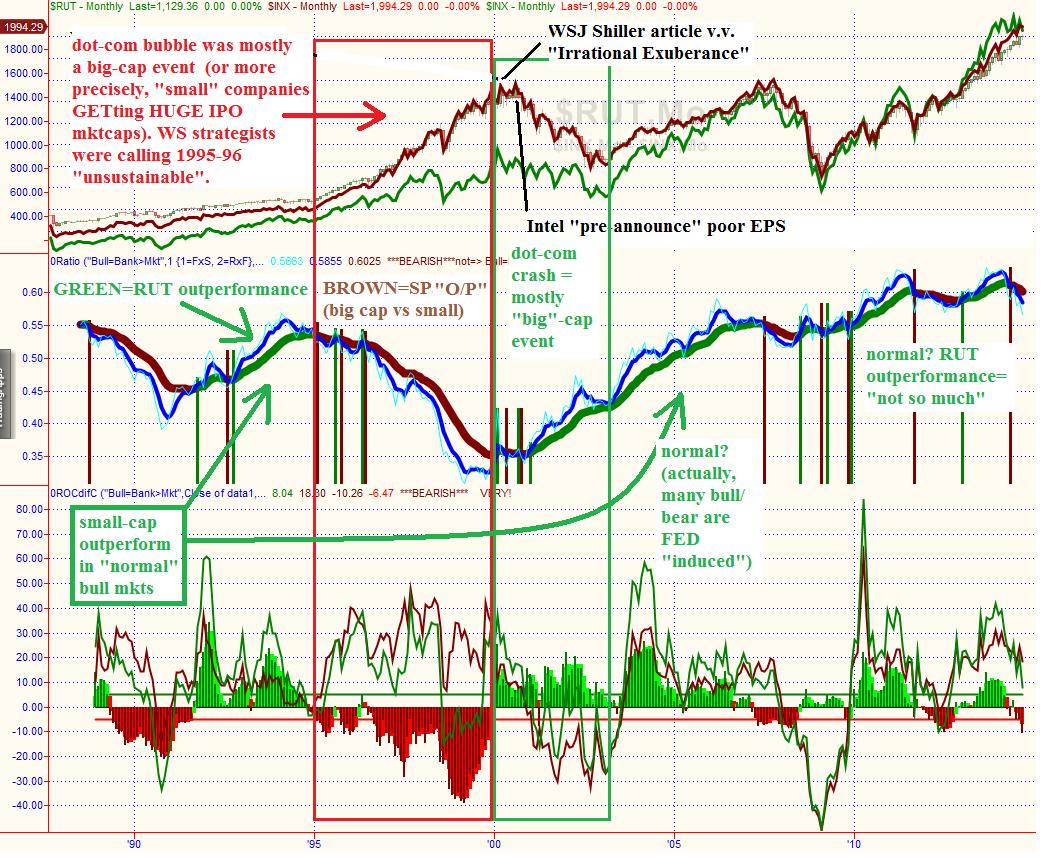
I don’t have much of an answer to the question posted here; however, I might have some insight (graphically).
Presumably we all know small caps outperform over the long term. A big question, which is also your question, is the RUT waving a warning flag (Yes!)? And the biggest question is what do you do about it?
fwiw, long story short, I joined P123 in FEB, created models that looked great so I started trading them in MAR, and got scared out with the APR swoon (too new to P123 to fully trust it with a BIG “behavioral finance” bias against losses). By AUG, my models were showing significant (recovery and) returns. So, being a glutton for punishment - realizing that SEP/OCT is dangerous, started trading my models again.
Since you’ve been around longer Andreas, how would you answer “What do we do about it?”
(having issues attaching, but my pics are the insight-?- I was talking about… sorry if they don’t attach)
Yes, but in the long term we are all dead.
The answer to ‘what do we do about it’ is really nothing unless one has a market timing model that says differently. Otherwise, one is just back in the mode of just following ones gut and we all know how that movie ends. I use P123 specifically to get away from gut instinct. I too have not been using P123 long but at this point I have more faith in what it can deliver, in terms of providing data and strategies, to make better informed decisions than just by reading the bloggers on Marketwatch.
Hi Andreas
Brad (OP) showed an interesting chart. The outperformance of small caps positively affected most P123 small/micro cap-biased strategies. In addition, value outperformed growth during 2000-2003. Both helped a lot to achieve super backtest results. Every time is different! And now with probably rising yields again will give a very dangerous mix to people that rely solely on P123 backtests. I would be happy if I achieved 1/2 of the annualized backtested performance and 1.5 times the drawdowns of my models, because as I mentioned every time is different. An OoS Sharpe Ratio of >0.7 including a bear market is excellent.
My economical explanation for the recent small cap underperformance is the following:
My advice: despite worse backtested large cap performance vs. small/micro, always diversify across the market cap range and still include more boring defensive and large cap models/strategy.
Good luck!
whotookmynickname
Andreas, a long time ago you wrote on the Forum that there was alot of Gold in scrapped models and freebie systems on the site. Why not develop your own version of Greenblatt? Forget the long term backtests for large cap value which mean little in small cap centric market, but take a look at shorter time frames like 2-3 years and you’ll see Greenblatt emerging with relative strength.
“Whotookmynickname”: Spot on. Look at what happened in the 2000-2002 time period where large cap growth rolled over and small cap emerged with huge relative strength. With the Fed transitioning to a pseudo tightening why can’t the reverse occur? You may argue that it really isn’t a tightening but we also have never seen an economy so dependent upon 0% interest rates.
Brad
Thank you for all the great Input!
Well, I can not remember a time small caps behaved since 1996 the way they do now.
At least they kept up with the Overall market.
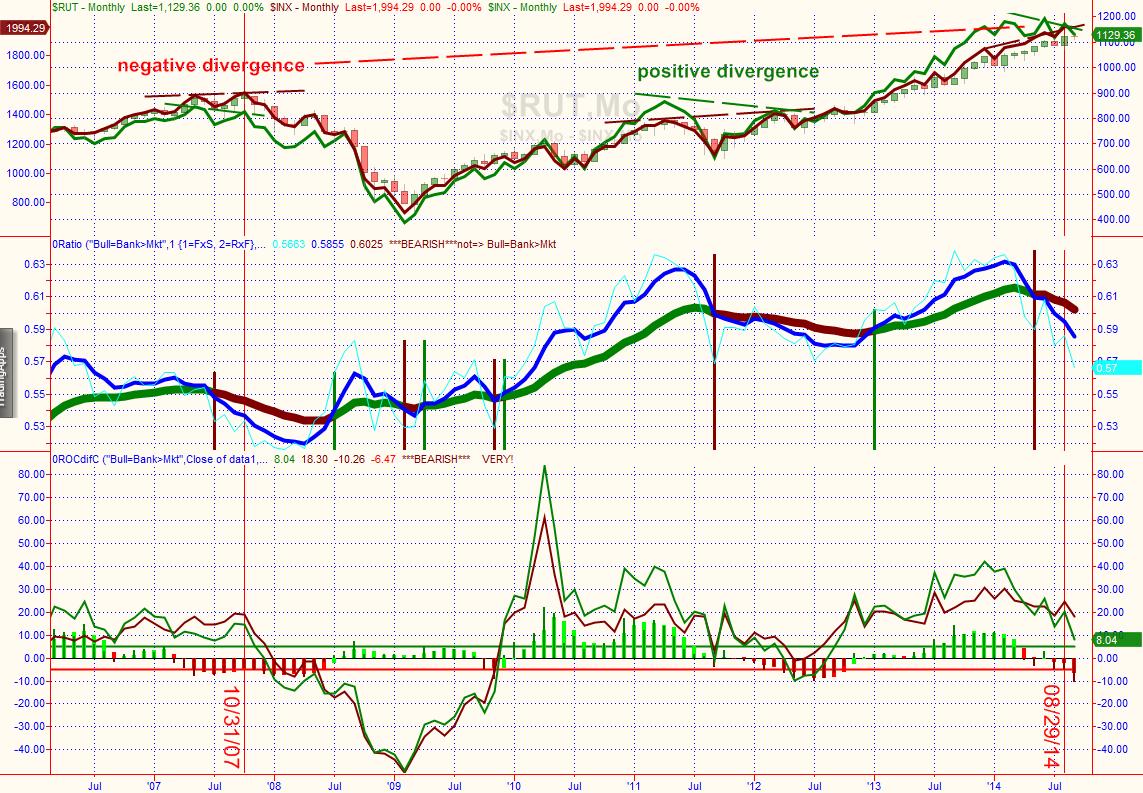
From what I saw before two major bear markets was, that small caps high beta stocks outperformed heavily
just before the market made a lower low and tanked afterwards (small cap managed to make a double top or even a higher high). That happened 2000 and 2008.
What is really interesting as well is that a lot of Long term growth stocks woke up (like ABT ADP AFL AMGN APA ATR AVP BASFY BP BTI CAJ CL CSCO DHR DIS EMC EMR GE GILD HD HEINY HOG HP IBM INTC ITW JNJ KLMR KO LRLCY MCD MDT MMM MO NSRGY NVS OMC ORCL OXY PEP PG PM PRU SAP SBUX SLB SYK SYY UL VALE VOD WAG WFC WFM XOM YUM)
Anyway, I do nothing and stick to the market as Long earnings trend up and not down.
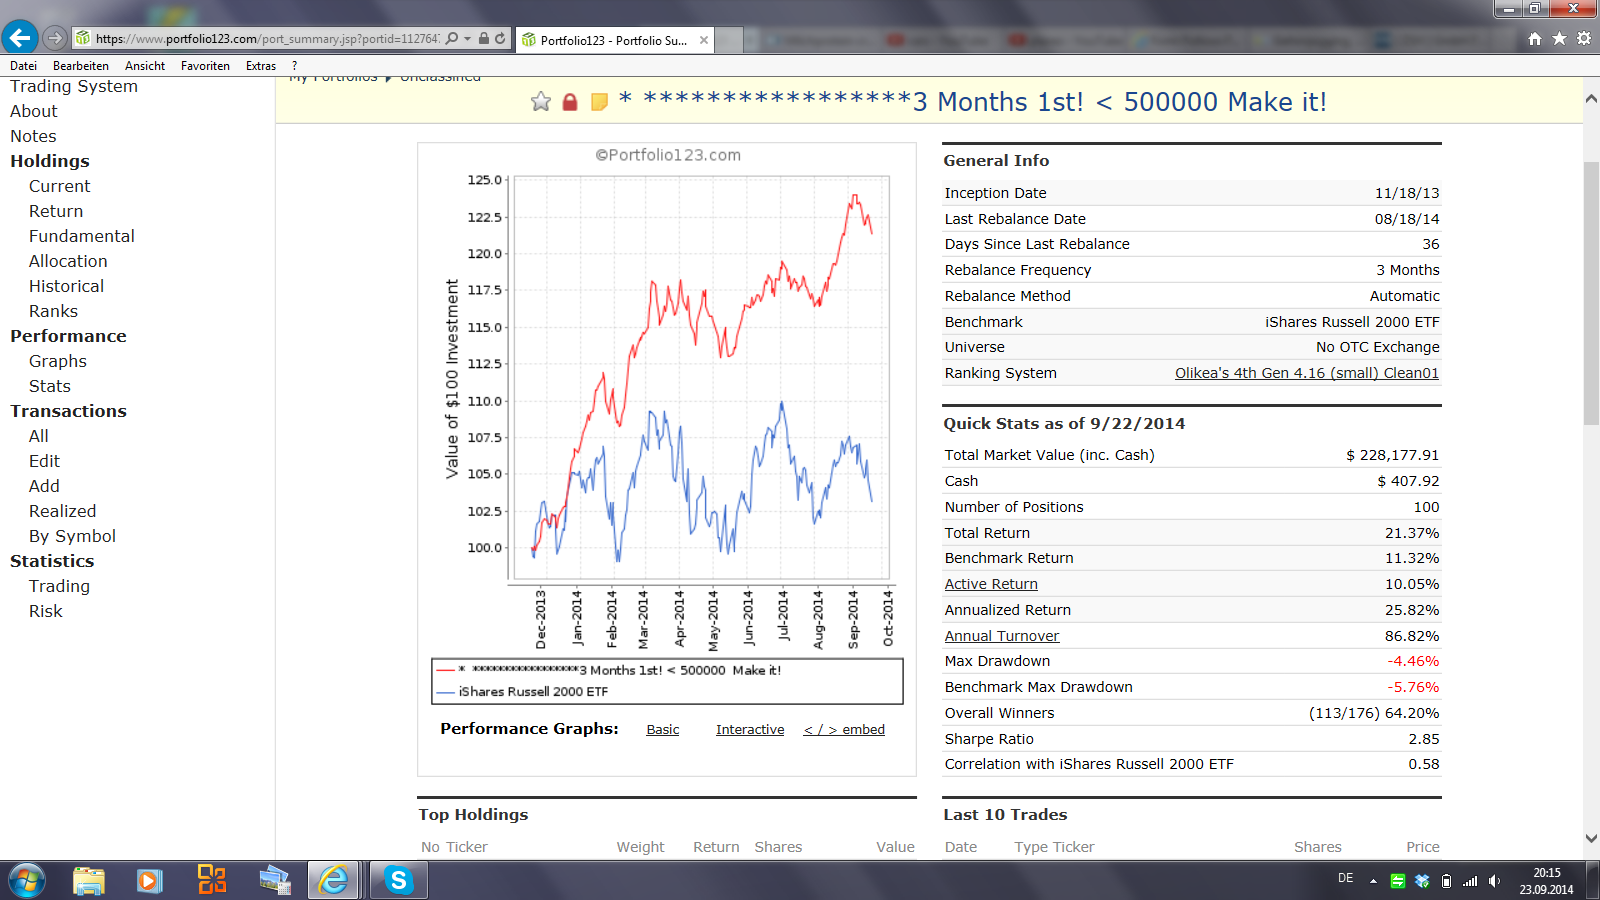
Attached a micro stock 100 Stock model that I trade with a 270k Account, 3 Month System, slow and steady, not much work, fits very well to me.
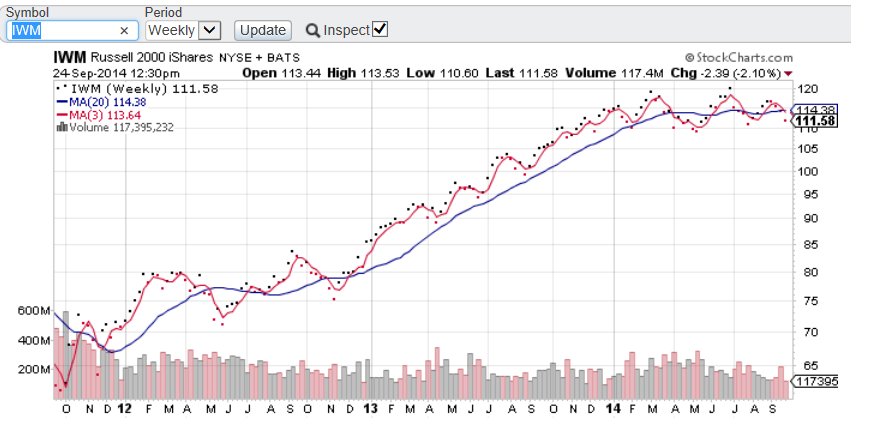
Seems you are asking the wrong question. The R2000 with div’s is up 8% over the last year with a peak DD of 9% or so. This is compared with 7.99%/yr average since 1999. So…Nothing’s really ‘wrong’ with the the R2000. It’s had a very average past 12 months. With very low vol. for this index historically. It’s just not having the very unusually high returns of the previous few years. It’s cooling and returning to more ‘normal’ performance.
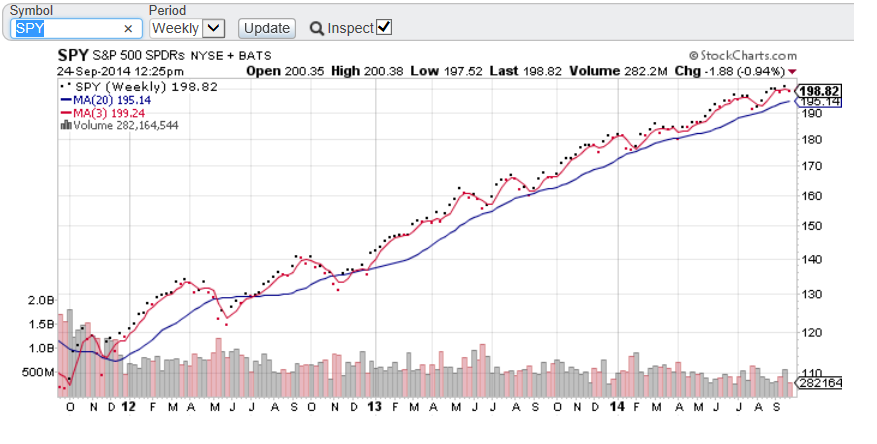
The SP500’s performance has fallen off less…it has averaged about 5%/yr since 1999. It’s up about 18% in TTM with only a 5% DD. After much larger trailing 3 year performance. So…large cap is relatively ‘more hot’ still right now. That’s it. Volume on SPY has fallen a lot. Was 210 Million shares in 9/09, 250 Million 9/10 and 9/11, 145 Million in 9/12 and 125 Million in 9/13, now down to 85 Million (trailing 100 day volume)…so volume is falling a lot in SPY even as price is still rising. 50Day RSI around 56. 371 stocks above 200 day moving average. So…all indicators are that it’s hot.
Just feels like a fairly normal ‘end of the run’ up market cycle. A time to not be taking on huge new risks.
It’s a 3 year huge run up (and really five years).
The SP500 is up and ‘more hot’ at the moment…but not a lot of money piling in…at least based on ETF, SPY.
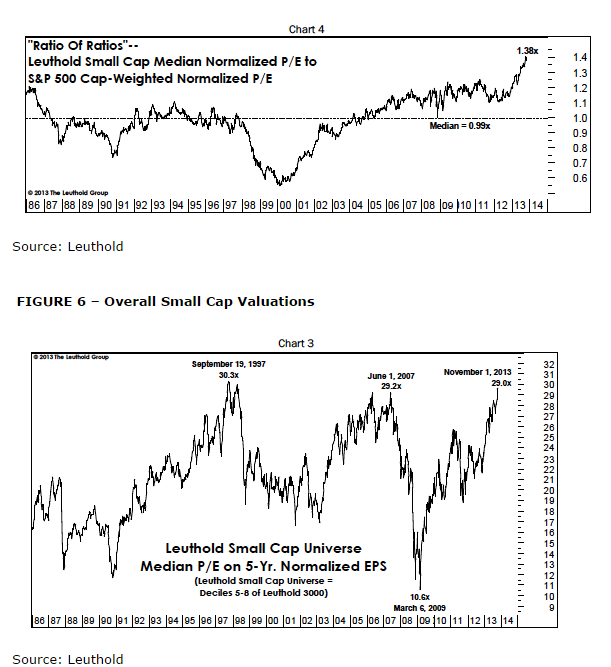
It’s funny, in the 1990s when small caps were undervalued, then it was considered quite “normal” they have a lower P/E - its to compensate you for higher risk.
The attitude has now flipped to the point where “of course” they have a higher P/E to represent their superior growth prospects.
It’s reminiscent of the old comparison between equities and bonds. In the past, it was considered normal that equities would yield more - more yield to compensate higher risk. That went out of the window, especially in the late 1990s with the idea they should have lower yield, even when looking at “earnings yield” because unlike bonds they could grow their yield in the future. It’s a pessimistic vs optimistic outlook.
Many of us have got “mktcap less is better” in our ranking systems, and we may need to question the logic of it. After all, this is true in simulation because it has been true in the last decade, but this is really driving by looking in the rear view mirror.
It may still be true, however, that it is still worth focusing on small caps because of the better relative performance (more alpha). But whether that is enough to compensate the overall drag is an open question, answered only with time.
It may be worth considering issues about mktcap diversification, and perhaps, more simply, just looking for value across the whole market without trying to bias for mktcap.
Oliver
If you think there’s something wrong with small caps it’s because you’ve gotten used to the FED orgy and its miracle effect on equities.
The question is not what the hell is going on with the russel 2000, it is what the hell is going on with the SP 500?
The FED has learned nothing about the past. They’ve replaced the housing bubble with the equity bubble. It’s ridiculous.
To mention the obvious the equity market is not supposed to grow by 20% a year when the GDP grows by 2% a year.
Just to perhaps counter that point, GDP is up ~60% while S&P is up ~35% since 2000. It all depends on the timeframe you’re looking at.
Here’s a chart showing the difference in SP500 120 day momentum vs. R2000 120 day momentum. Whenever it’s above 0, the SP500 is ‘outperforming’ relative to the R2000.
See (public chart):
120Mo-SP500-Rut2000
The current outperformance is not that unusual…but most instances of previous outperformance over trailing 15 years have either occurred with, or just before, a real market correction.
Tomyani, can you post the link to that chart? I haven’t been able to find it.
Thank You.
http://www.portfolio123.com/app/screen/summary/591?st=1&mt=8
There are a ton of charts that can be made this way to compare ‘trend lines’ between indexes. It’s a very powerful tool.
That was quick, thank you.
All:
There are a lot of good answers to the thread's question. One answer is that SPY has continued the 2013 up-trend in 2014 while IWM has been going sideways. [See attached charts.]
Bill
I’ve done a bit more looking and I tell ya, I’ve figured out that I’m brilliant, as are most of you… after all, aren’t most of us using some variation of the early public models that focus on (ie BUY) SMALL CAP stocks with a BIG VALUE factor?
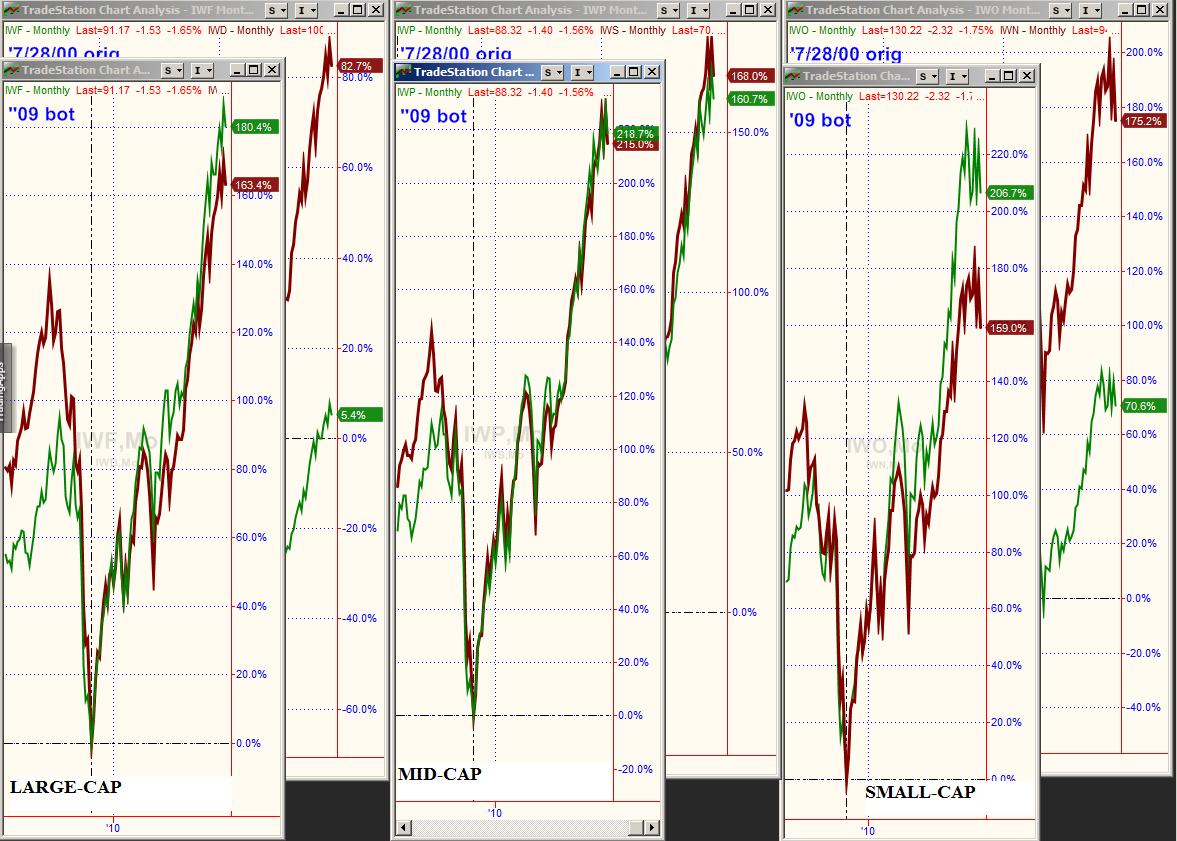
The charts in the pic below show Russell ETFs around 7/28/00, or about the same as P123’s data starts. The ETFs are divided into LARGE, MID, AND SMALL CAPS and GROWTH vs VALUE(“growthy green” and “value ‘crap’”). The “partially hidden” charts are since “inception” (all=~7/28/00) while the “overlay” (front) charts are since the '09 bottom. Since inception, SMALL CAP VALUE wins (these are price only returns, but value has higher dividend yields and the total returns according to Blackrock are close matches to these charts, esp. in regards to comparability).
Like I said, “we’re all brilliant.”…
with one caveat: in the MID-CAP size, “there ain’t no difference between Sally and Sue”.
Oops: another caveat: in a strong bull market, “there ain’t no difference between Sally and Sue”
(ok,ok, growthy Sally has a slightly better return, but Sue’s still a good value!).
(fwiw, these funds are equal-weight)
And finally, despite what you see in the mkt, especially today’s 1.5+% loss, looking are relative performance charts and my ratios charts, it’s still too early to say “the fat lady is singing”… but it sure feels (or should it be spelled fells?) like she’s at least warming up!
The tendency of smaller stocks to outperform over the long term is very well documented (the “small-cap effect”). But like other such phenomena, it is not simply a statistical trend. It’s the result of characteristics inherent to smaller firms that better position them for superior long-term performance.
One, obviously, the relative ease with which these companies can post big growth rates: i.e., it’s easier for a retail chain with three stores to double than it is for one that has 3,000 stores. Another important factor is operating leverage; fixed costs or step costs (costs that are fixed for a certain range of business size, step up at a certain point and then stay fixed again until the next plateau is reached) loom larger for smaller companies. So as revenue grows, the rate of earnings growth gets leverage upward as fixed/step costs gradually diminish in impact. And financially, smaller firms tend to be more equity heavy but as they grow, many feel more comfortable adding more debt to their cap structures thus introducing another layer of upward leverage. And there’s the nature of the organization itself: smaller firms tend to have smaller internal bureaucracies and, hence, can act more quickly and more vigorously. Stocks respond sometimes to the realities of these factors and other times to expectations that such factors, not heretofore manifest, will impact the firms going forward.
On the other hand, small cap risks are likewise fundamentally derived. When times are tough, operating leverage hits the bottom line pretty hard. And smaller firms tend to have a lot less internal diversification thus leaving them much more exposed to marketplace problems that in larger firms can be invisible due to the impact of corporate cousins with different business exposures. Bigger firms benefit from economies of scale. And the quicker decision-making, small firms are more exposed to business errors.
During my time in the market, I’ve seen one prolonged period of big cap superiority during a time of catch-up, as big caps corrected what had become excessively low valuations (and during the same time, big cap companies got serious about internal efficiencies thus enhancing earnings in addition to margins). That’s been long played out by now. More recently, episodes of big-cap superiority seem to have been much more associated with risk-off investment climates as well as relative valuation tendencies.
For now, I think we’re seeing both. It’s harder to find eye-catching small-cap valuations than was the case a couple of years ago (it can still be done, but we have to work harder). And global tensions do seem to be pushing the market more toward a risk-off stance.
It also depends on the market valuation multiple in that specific moment in time.