Custom series seems off

I created two different custom series with the same rules but they show very different outcomes. The only difference between the two series is that in the first one, I put my criteria in the rules tab and in the second one I put my critieria in a custom universe. I don’t understand why they don’t produce the same (or at least very similar result). I made both series public and describe them further below. Thanks for the help to whoever responds!

First Custom Series: “Low$$EqWght$1to$5V2D”
https://www.portfolio123.com/app/screen/summary/561?st=1&mt=8

The only rule in this first series is:
LN(UnivAvg(“AvgDailyTot(2,2)>500000 AND Close(2)>1 AND Close(2)<5”,“Close(0)/Close(1)”))

The above public custom series is an equal weighted cumulative lognormal return index for PR3000 stocks w/ vol>$500k and stock price b/w $1 and $5. The final value of the series is 2.64, which implies a 1300% increase in index value between 9/1/2001 and 9/14/2014. (e^2.64=14.0, which implies a 14x increase in value or 1300%).

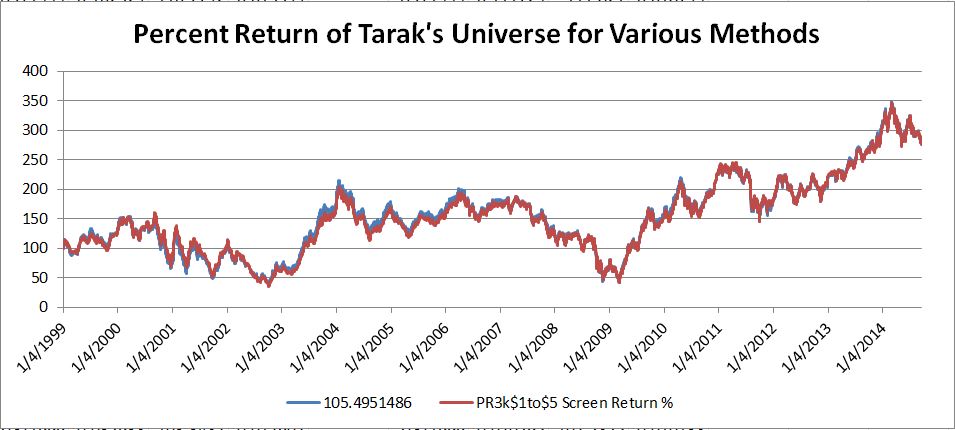
Second Custom Series: “PR3k$1to$5CustUniv”
https://www.portfolio123.com/app/screen/summary/562?st=1&mt=8

The above public custom series is the same as the first except I put the 2 criteria listed below into a custom universe:

AvgDailyTot(2,2)>500000
Close(2)>1 and Close(2)<5

Public custom universe used above is named “PR3k $1to$5 Stock Price” and is linked here: https://www.portfolio123.com/app/screen/summary/113929?st=1

Then the only rule in my second series is:
LN(UnivAvg(“TRUE”,“Close(0)/Close(1)”))

This second series has a final value of 1.41 which is much lower than the 2.64 from the first. The 1.41 final value implies e^1.41=4.1x growth or 311% growth over the full period… very different outcome compared to the first series.

Thanks for the help!

You need to set the base universe to “PR3k $1to$5 Stock Price”. When I do, the outcomes for both approaches is 4.61.

David, I think when you used the custom universe in both series, that ended up doing all of the filtering at the universe level and so you can’t really see if the UnivAvg(“criteria”,“formula”) is correctly applying itself only to stocks that match the criteria.

My question is why the two approaches I used don’t lead to the same outcome. It makes me wonder if the “criteria” parameter in UnivAvg(“criteria”,“formula”) function is working correctly or if there is a logical error on my part.

The first series I described uses PR3000 as the base universe. It only puts the criteria in the first parameter of UnivAvg(“criteria”,“formula”). I would think this should lead to the same result as the second series I described where I only put the criteria in the custom universe and do not include any criteria in the UnivAvg() function except for the “TRUE” placeholder.

I stil get same answer for both:
a. https://www.portfolio123.com/app/screen/summary/565?mt=8
b. https://www.portfolio123.com/app/screen/summary/561?st=1&mt=8

All I did was set the Base Universe of vustom Series “PR3k$1to$5CustUniv” to your public custom Universe “PR3k $1to$5 Stock Price”.

Strange. Not sure why, but I’m not getting the same numbers as you. I clicked on the links in your post and here’s what I saw:

First link:

If I run it as is, the last value is 15,000. I notice that your rule is:
Rule: LN(UnivAvg(“TRUE”,“Close(0)/Close(1)”)*100)
It seems like you incorrectly put a 100 in there, so I removed the 100 and changed the rule to this:
LN(UnivAvg(“TRUE”,“Close(0)/Close(1)”))
Now, the last value I see on the chart is 1.41.

Second link:

I run the chart and the last value on the chart is 2.6.
Not sure how to copy the graphs and put them in this message, so I downloaded the series to excel and am attaching the spreadsheet with the numbers I got for both of the links.


Strange Low $$ Series.xlsx (147 KB)

Still getting 4.61 for both "Low$$EqWght$1to$5V2D " and "PR3k$1to$5CustUniv " if I set the “Base Universe” of the latter Custom Series to Custom Universe "PR3k $1to$5 Stock Price ".

Are you sure you’re setting the base universe correctly? Whenever I select your link, I have to manually change the default universe from Prussel 3000 to “PR3k $1to$5 Stock Price”.

When I click the links in your post, I’m not adjusting the base universe since it’s already set… one has PR3000 and the other has the custom universe. In general though, I’ve used custom universes for other things without getting weird data, so I’m pretty sure I know how to use them.

Also, your 4.61 number doesn’t seem to be right. If the last value on the graph you see is 4.61 that implies the cumulative total return for the index is e^4.61=100x or 9900% from 9/1/2001-9/14/2014. That doesn’t pass the sniff test. When you run the same criteria in a backtest, set the universe to PR3000 and put the criteria in the rules, set it for 0 slippage and daily rebalancing just like the series, you get 284% total return over the period. I’m guessing the backtest is giving the right answer. See link: https://www.portfolio123.com/app/screen/summary/113936?st=1

Out of the final values I got for my custom series, 1.41 and 2.6, I think 1.41 is probably the one that’s closest to right since e^1.41=4x total cumulative return or 310% total cumulative return which is the closest to the backtest results of 284%.

When I first did this, I realized there could be a look ahead bias in the custom series if your criteria are based on bar 0 and your output also includes bar 0 in the formula. However, I think I took care of that potential explanation by using a 2 bar offset for the criteria in the custom series.

I see what you’re saying now. I was hyperfocused on the single result the you get when you select “Totals” under the Rules Tab. Apologies for not understanding your issue. Long story short, I may have come close to unraveling this by comparing Screener performance versus calculated performance in the Custom Series Tool. However, there are some unanswered questions.

First of all, questions… why do you use two day offsets? I thought that since P123 was point in time, calling a line item with an offset of (0) would get the last available datapoint. I were to run a screen consisting of Close(0) today with the date set to yesterday, it would fetch the day before yesterday’s close. Am I correct, or do we need these offsets avoid data snopping (i.e. look-ahead bias)? Also, I was wondering why your threshold for dollar-volume constraint of $500 billion/day is set extraordinarily high for low priced stocks. Unless you’re moving millions of dollars in and out of the market everyday, I would think you get get by with a much lower constraint.

To test this issue, I created a stock screen which calculates performance based on holding stocks which meet Tamak’s liquidity constraints. This publicly available screen is entitled, "PR3k$1to$5 Screen ". You notice that the offsets are set forward by one day in the screener. I set these forward because screener bases performance on the parameters that were available the day prior; I think that the Series Tool may not have these caveats built into it. The performance estimates for daily rebalancing from the Screener closely resembles the returns using the approach in “PR3k$1to$5 - Copy(2)”. However, between the screener implemenation and that of "Low$$EqWght$1 - Copy ", the net return results are way off. Of the two approaches, the approach used in “PR3k$1to$5 - Copy(2)” should probably be used to for apple-to-apples benchmarks comparing a investment approach to the “dumb index” consisting of similar stocks since it more closely matches P123 back-end implementation. See below for results.

One possible explanation for the deltas is that the Custom Universes on which the Custom Series recalibrate on a weekly basis regardless of whether weekly or daily “rebalancing frequency” is selected. I’ve compared the total number of stocks meeting the critera for both Custom Series. I can see that the graphs are not identical, which would throw off the estimate. In fact, the weekly and daily counts for PR3k$1to$5 - Copy(2) are identical if you do a “Hold” type of interpolation between dates (i.e., use the last known value). These values also match the weekly counts for Low$$EqWght$1 - Copy . In fact, the only method that produces unique result is daily counts of stocks in Low$$EqWght$1 - Copy. You can see the result below. If it is the case that Custom Universes recalibrate on weekly basis only, then P123 might need to tweak their code in order to achieve consistent results using various methods. In general, good design is “Pythonic” in that it gives end-users “one right and obvious way” to approach a problem-set like this. Given the consistency in weekly counts, it would seem fairly obvious to calculate weekly returns for the benchmark. However, P123 doesn’t offer syntax which allows us to offset prices by weeks in the Series Tool without using nested quotations. Perhap P123 could implement a feature which allows users to reference price and fundamental data points offset by weeks in addition to days.

If I had to guess anything, I would bet that the method used in “PR3k$1to$5 - Copy(2)” would be more accurate since it adjusts to the universe size on a consistent frequency as found elsewhere in P123. It is also much more closely resembles the performance of the screen implementation, although screener criteria might be offset by one additional day.

While I have gotten close to a result I am comfortable using in produciton, I am still not 100% on this. You would think that equal dollar indices were simple to implement and that there would be little room for discrepancies, but after playing around with this, I am left wondering if there is a better approach.


Tamak,

Sorry for misspeling your name. It’s late. I am tired. This stuff hurts my brain.

  • David

Dear Portfolio 123 staff,

I believe this issue deserves your attention because it appears to be a very large error in how the UnivAvg(“criteria”,“formula”) function is working.

I realize my original post may not have been clear enough given the strange names for the custom series and the fact that log math isn’t familiar for everyone, so I’ll try to my best to explain it more clearly here:

First, the relevant log math identities that I use:

  1. LN(x*y) = LN(x)+LN(y)
  2. If LN(1+R) = r, then R=cumulative simple return and r=cumulative lognormal return
  3. If LN(1+R)=r, then e^r=1+R

Second, I want to create a custom series that shows me the equal weighted index for stocks that pass the following CRITERIA within the PR3000 universe:

  1. AvgDailyTot(2,2)>500000
  2. Close(2)>1 AND Close(2)<5

There are two ways to do this. Option 1 puts the CRITERIA in the UnivAvg() function, and Option 2 puts the CRITERIA in a custom universe. Option 1 produces a chart that is definitely wrong, and Option 2 produces a chart that is probably right.

Option 1: https://www.portfolio123.com/app/screen/summary/561?st=1&mt=8
Option 2: https://www.portfolio123.com/app/screen/summary/562?st=1&mt=8
Custom Universe Used in Option 2: https://www.portfolio123.com/app/screen/summary/113929?st=1

For both options, when you create the chart, make sure it’s set for daily rebalancing, transform: cumulative, time frame: 9/1/2001-9/14/2014. The last line in rules is computing the LN() of the average close(0)/close(1) ratio for stocks that match the CRITERIA. Using Log Math Identity #1, the transform: cumulative function allows you to add up the lognormal returns so that the when you look at the custom series chart the last value (on 9/12/14) is the cumulative lognormal return (see definition in Log Math Identity #2).

Option1: Cumulative lognormal return = 260% // because the custom series value on 9/12/14 is 2.60
Option2: Cumulative lognormal return = 141% // because the custom series value on 9/12/14 is 1.41

Now, using Log Math Identity #3, we can convert the above numbers into cumulative simple returns (the type of return we’re all used to using).

Option 1: Cumulative simple return = 1246% // e^2.6=1+R… solve for R and you get 1246%
Option 2: Cumulative simple return = 310% // e^1.4=1+R… solve for R and you get 310%

I believe Option 2 is correct and Option 1 is very wrong, which is troubling because it means that putting criteria in UnivAvg(“criteria”,“formula”) will probably give you an incorrect graph.

David -

Answers to your questions:

  • I used $500k as the liquidity filter not $500B
  • I used a 2 day offset to avoid look ahead bias in the custom series. This is not necessary in sims or backtests
  • I agree that I’d like to be able to do weekly rebalancing in custom series but close(0)/close(5) is not the same as weekly since some weeks have less than 5 days, so P123 would have to create a weekly total return formula to allow us to actually use the weekly rebalancing option they’ve created.
  • I didn’t exactly understand everything you wrote in that last post, but at this point, I think it’s in P123’s hands to figure out what’s causing the problem and how to fix it.

Thanks,
Tarak (Tamak is just the screen name, I’ll respond to either :slight_smile:

Sorry it wasn’t clear. I think my main point was that a “dumb benchmark/index” created in the Series Tool should match the returns using the same filters in the Screener. As it turns out, your method #2 in the prior post seems to get you very close. Perhaps it’s off due to the way in which dividends are accounted for. The rest of the post was just trying to hash that out a bit.

Still no resolution from P123 staff…

*** BUMP ***