Analyzing volume and spreads intra-day

Hi,

I spent some time doing an analysis of the intra-day spreads and volumes for the stocks I (and many here) typically trade. Maybe the results are useful to some of you.

I collected all recommendations of around 5 R2G models I have subscribed to for varying periods with varying liquidity (less than $100K to $1MM). I also added recommendations from three of my own models (recommendations from the sims, not live, but I do trade those live) with similar liquidity. In total, I got just over 1,000 recommendations over the past year. I then programmed a little tool to query the Interactive Brokers TWS API to obtain minute-by-minute open/high/low/close prices, bids, and asks, plus volume for each minute on the day of the recommendation. I can only go back one year with this API and a handful of stocks are no longer traded. But the results should still be fairly representative for the typical models people trade on P123.

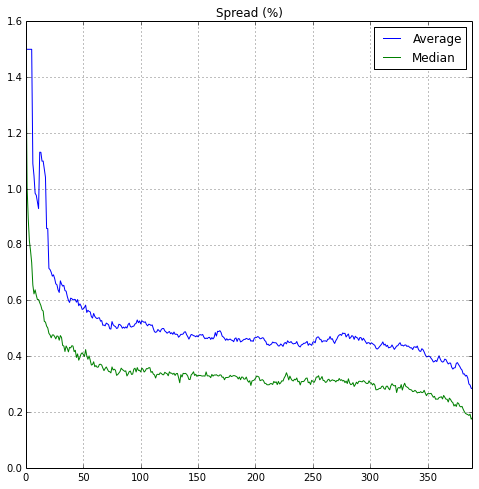
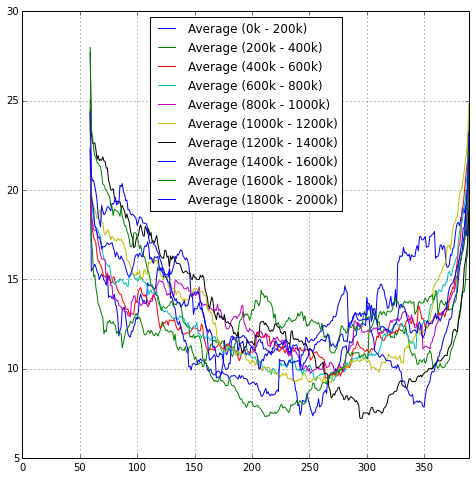
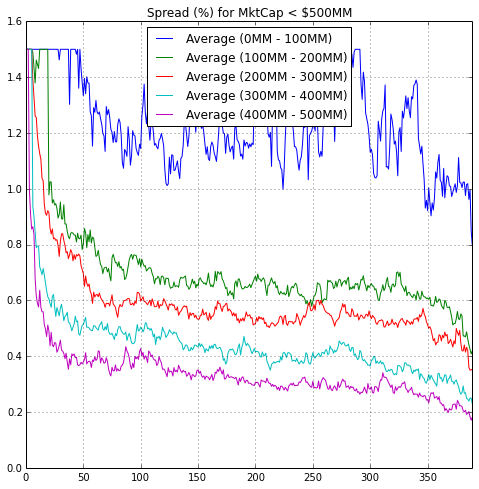
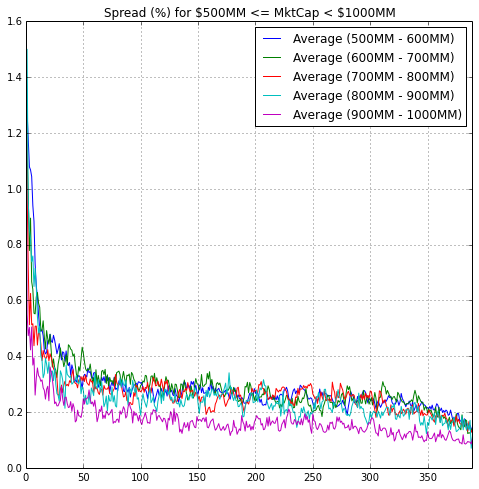
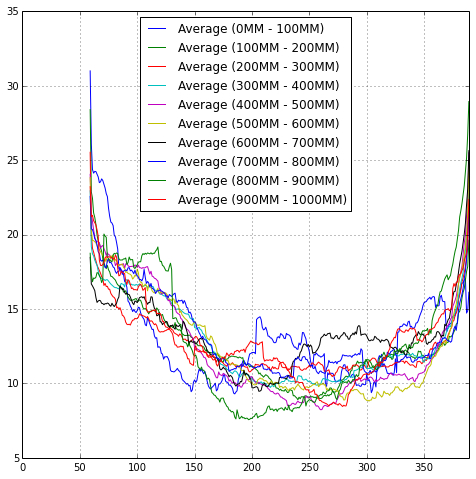
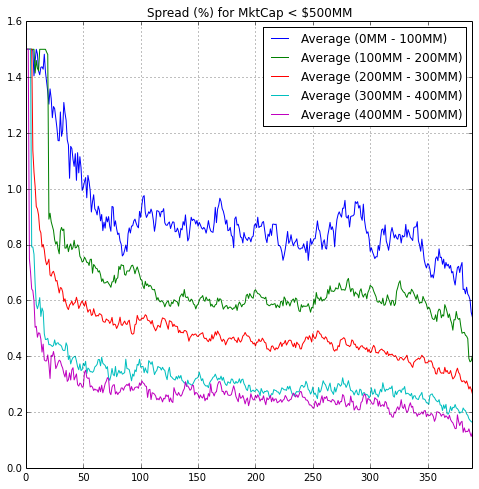
First, the bid-ask spreads. See the chart below titled ‘Spread (%)’. This shows the spread in percentage points, computed as (ask - bid) / bid * 100%, for each minute since the opening of the exchange. The minutes since opening are on the X-axis, spreads on the Y-axis. So for example, 50 minutes after opening (10:20 AM) the average spread is around 0.4%. (Btw, in this chart, I limited the spreads to 1.5%. The average spread at the open is 1,803,370%, after the first minute it’s 2.95%, drops gradually to 2.11% after 5 minutes. In the chart this is just a flat line at 1.5%).

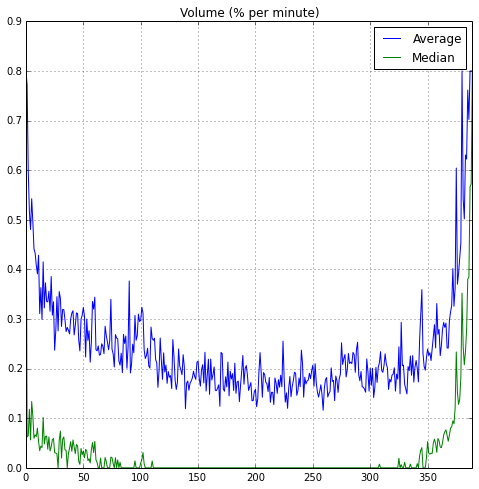
Second, the volume. The chart titled ‘Volume (% per minute)’ shows the percentage of daily volume traded each minute. What I mean by that is that, for each stock, I calculate the total volume on the day it should be bought/sold according to the recommendation, and then for each minute of that day I divide the volume of that minute by the total volume for the day. Those numbers are then aggregated per minute. So the chart shows that between 10:20 AM and 10:21 AM (after 50 minutes) the average volume is somewhere between 0.3% and 0.25% of the daily volume. (Btw, again, the numbers are limited. The opening volume 4.5% of daily volume, and the closing volume is 2.7% of daily volume).

Summarizing, the spreads are quite large in the first hour of trading, and narrow a little in the last hour. Volume is highest near the opening and closing, and many stocks do not trade much at all between 11:30 AM and 3:00 PM (median volume is 0, so half of the stocks has no volume at all).

Trying to trade at the open seems a good idea (if you’re careful with limits). But it also seems that if you want to trade higher volume you’ll have to trade either early or late in the day. Early in the day you’ll have (much) higher spreads, and later in the day our systems typically degrade in performance.


spreads.png


volumes.png

Thanks for the insightful analysis!

Since 2009 I haven’t traded any stocks without at least $200K liquidity because of the high opening spread of lower liquidity stocks.

Can you separate the data by liquidity ranges like $100K or $200K ranges to see the affect of the higher liquidity on the bid-ask spread & volume?

My results since 2009 imply that the spread on $500K + liquidity stocks is almost always less than 0.5% within 30 minutes of the open.

Denny :sunglasses:

Wow. Excellent work. So we have to assume .2-.4% slippage if market orders are used, basically.

I did some crazy spread modelling over at my last hedge fund at b/c we were working with high turnover strategies. It’s almost like a black magic regression trying to guess the spread based on price, volatility, average volume, and shares outstanding. the results modelled something that normal people intuitively know, i.e., it showed mathematically that were over-trading and over-trading at the wrong time. Hoodoo or not, we performed much better after this analysis than before due to improved execution.

Here are some charts breaking it down by liquidity. Please note that the liquidity I used is the liquidity (total $ amount traded) on the day of the recommendation only, not on the preceding days.

I created two charts to show the spreads for liquidity between 0 and $2MM with increments of $200k. Lower liquidity definitely means (a lot) higher spreads. Above roughly $500k - $1MM the difference in spreads isn’t that large anymore, but spreads stay high all throughout the day for lower levels of liquidity. (Btw, I haven’t included the chart, but for the liquidity range 0-$100k the average spread never dropped below 1.5%. There weren’t many stocks in this range though.)

The pattern in volume is quite similar for each level of liquidity, at least by eye balling the attached chart. This chart shows the average percentage of daily volume in the preceding hour. If I create the chart minute-by-minute as in the first post, there is so much noise you don’t see the pattern anymore. The shape of the curves is what is important here. (Example on how to read the chart: the black line for $1200k-$1400k is approx 15 on the Y-axis at 150 on the X-axis. This means that 15% of daily volume is traded in the hour between 90 and 150 minutes after opening, ie 11:00 AM and noon. The peaks at 60 on the X-axis are the volume traded in the first hour, including the open).

For completeness, I included a histogram of the number of recommendations in each liquidity bucket (the number on the X-axis is the lower bound of the bucket). In total, just over half of all the recommendations I used have liquidity < $2MM. (So the rest is higher, explaining the averages in the charts in my first post. I initially thought I traded lower liquidity stocks…).


spreads-low-liquidity.png


spreads-higher-liquidity.png


volumes-rolling-mean.png


number-of-stocks.png

Impressive. Thanks!

Thanks!

The charts show what I have found over the years trying to trade small and micro caps. That is why for many years now I have only traded Market orders after the market opens. I trade my large caps (>$10Mil liquidity) generally 5 to 10 minutes after the open, My mid caps ($1Mil > $10Mil) 10 to 20 minutes after the open, and my small caps ($200K > $1Mil) around 30 minutes + after the open.

I have to wait that long to allow the spread to narrow to an acceptable level. I place market orders because when I place them I know within a very small % what my fill price will be, and I don’t have to chase the price throughout the day with changing limit orders.

The above is what I do for “normal” price action after the open. For a stock with abnormal opening action (a faster changing price than normal) I have found the spread narrows much sooner due to the higher volume accompanying the faster moving price. with a buy, if the price is rising quickly after the open I will accept a larger spread to acquire the stock sooner, and if the price is falling I will delay a buy until the price levels out or starts to rise. I do the opposite for sells.

My approach will have all my trades made within about 30 minutes Monday morning except for the occasional stock with a falling price. Those I check occasionally through the day. That approach has allowed me to beat the performance of many of my Ports.

Thanks again for excellent visualization of the spread effect after the open,
Denny :sunglasses:

Denny,

Good to hear that my findings are similar to your real life experience, and many thanks for sharing the details on your execution strategy!

Just one question, do you ever place limit orders before the market opens? Why or why not? Do you do this only for some liquidity levels or not? The benefit of being filled at the open would be that your spread is zero.

I have been placing limit orders with the previous close as the limit. I always had this voice in the back of my head saying that I might be moving the open price by doing that. Now that my data shows that only around 4-5% of the daily volume is traded at the open, I’m quite sure that I made trades where I moved the open price. I try to trade max 1.5% of daily volume, but that’s still a large chunk of 4-5%. I’m considering not using any limit orders at the open anymore, or perhaps only for tiny percentages of daily volume. Any thoughts would be appreciated!

Excellent stuff pvdb, thanks for shaing your work, it is very interesting.

I use VWAP orders to distribute the trade over the day, trading on average 0.5-1.5% of the avg.daily volume of the stock and my orders tend to get prices 15-20bps over the close on average, which so far is very close to the vwap on the day. Liquidity is between $250k-2m and I have found that the correlation between spread vs closing price and my trade size as a % of the volume on the day of the trade is pretty much 0.

Denny, could you give us an idea of the slippage you get vs opening prices if you have calculated this? Does it vary a lot by liquidity level?

pvdb, I can only echo what the others say; excellent work and thanks for sharing!

There has been a difference of opinion here if spreads are more correlated with the amount of dollar volume or the size of the Market Cap (or even the amount of volume unadjusted for share price). Can you do an analysis to see which one is more correlated to the size of the spreads?

Thanks!

It looks like spreads get slashed in half between 10:00am to 3:50pm. That may be useful to know if and when we ever get to use live or even delayed quotes for live portfolios.

Chipper,

Sorry, I don’t have the data on market cap so I cannot easily test that. Intuitively I’d think liquidity is more important, but that’s just my guess. Also, free float seems more appropriate than just market cap. If you’ve got a link to the previous discussion I’d be interested in reading it. I might be tempted to spend the time to gather more data.

Also, please note that I have only used liquidity (volume) on the day of the recommendation, which may be a very noisy estimate of the “true” liquidity of a stock. When I have time I’ll try to see whether an X day average or median makes a difference.

Thanks,
Peter

Peter & Iavanti,

Before I joined P123 (March 2004) I only traded mutual funds and large caps because I couldn’t find a good reliable way to safely trade micro caps. Since I didn’t need to go to work before 9:00 central time I could make my trades right after the open and then leave for work. After joining P123 I leaped into micro caps trading with market orders right after the open as I had done for large caps, but quickly realized I was frequently getting slippages from 2% to 5% on both buy and sell fills. Since I had worked with date as an engineer for over 30 years it was natural for me to record the Port’s recommended price, the open price, and my fill price on every buy and sell. So I had the data to compare my trades to the Port’s. What I was doing wasn’t working.

Because I was trading through Fidelity I had access to level 2 quotes so I started monitoring the spreads on my microcaps. That was eye opening. The spread right after the open might be 2% with less than a few hundred ask shares listed while I was trying to buy 2 to 5 times that number of shares. My fill would frequently be as high as a 5% slippage relative to the quoted open price even though the spread at the time might be only 2%. That affect caused my actual results to be a significant loss relative to the Port’s Sim of over 100% annual return. It didn’t take more than a few months for me to realize that if I was to trade micro caps I had to change the way I traded them.

I first switched to limit orders at the open since I could set up the trades the night before, but after a few months my data showed 2 significant problems. I was not getting fills on many stocks that opened higher than my limit and continued higher throughout the day. I would check my trades that evening and found that some of the stocks that didn’t get filled were now 5% to as high as 20% above the open price. Also I was buying many stocks at the high of the day as the price started down and continued down throughout the day. Those 2 problems, although affecting only maybe 10% of my trades, made a huge difference in the performance of my portfolio.

I then went back to market orders and carefully watched the level 2 quotes before sending the order making sure the spread had narrowed. I also had raised my minimum liquidity to over $200K so the opening ask volume would be sufficient for the number of shares I wanted to trade. Over the next year I gradually adjusted my trading to the approach I described in my post above. That has been very successful, and since about 2005 I have been able to beat the performance of the Ports most of the time.

Denny :sunglasses:

Denny you posted your trading methodology in this thread and I found it very useful.

https://www.portfolio123.com/mvnforum/viewthread_thread,6534_offset,0

I recommend anyone trading small caps read it. You will need a very good trading platform especially when you have multiple books.

Thanks again Denny,

Regards,
Mark V.

Denny, I like your system.

Do you use for the slippage benchmark in your Ports the Hi/Low Average?

David,

No, in a Sim I use next open because that is what I try to trade. Since a Port always uses previous close there is a slippage difference between a my Sim and a Port.

To adjust for that in a Port I add the slippage difference I get between a Sim run with next open and a Sim run with previous close. To determine that I compare the average gain / stock for each Sim. The Sim run with next open will have a lower gain / stock than the Sim run with previous close (at least all of my Sims do). everything else equal, that difference will be the sum of the average of the buy slippage + the sell slippage. So I add 1/2 that difference to the Ports slippage.

Denny :sunglasses:

Got it. Open is pretty aggressive and hard to get, even sporadically, from my experience. You are getting good results then with your trading method.

Chipper was kind enough to provide me with MktCap data I needed to extend the analysis to different ranges of market caps. The result is below, and the (average) spread seems to be quite nicely correlated with market cap!

To some extent this is not really a surprise, because the correlation between volume traded on the day in question (as I analysed before) and the market cap is about 0.5 for my dataset. I am a bit surprised that MktCap works so well though.

The spread is consistently lower for higher market cap, and the differences are quite large for MktCap < 500. Note that I have very few stocks with MktCap < 100, so the average spread for that bucket may be unreliable. Also I don’t have that many stocks in the 500 <= MktCap < 1000 range (see histogram below), but the spreads seem to be fairly similar to each other.

The pattern of volume during the day seems similar to the charts I’ve produced before and do not differ a lot per MktCap. The first 2-3 hours and the last hour of the trading day consistently show highest volumes.


spreads-low-mktcap.png


spreads-higher-mktcap.png


volumes-rolling-mean-mktcap.png


number-of-stocks-mktcap.png

And finally the results when I use float instead of MktCap. The higher float (>$500M) chart is pretty similar to the one above for MktCap >= $500M. Correlation between Float and MktCap is as high as 0.9 for my dataset.


spreads-low-float.png


number-of-stocks-float.png