You can now preview what our upcoming “Market Score” tool will be able to do. It will be a way to create a multi-factor, Piotroski-like score of TRUE/FALSE conditions for market timing purposes. It will initially offer economic data from FRED going back as far as possible, other top-down indicators like our own Fed Model, and later on, breadth indicators. We will add indicators by request as well.
For example assume you think these conditions are bearish
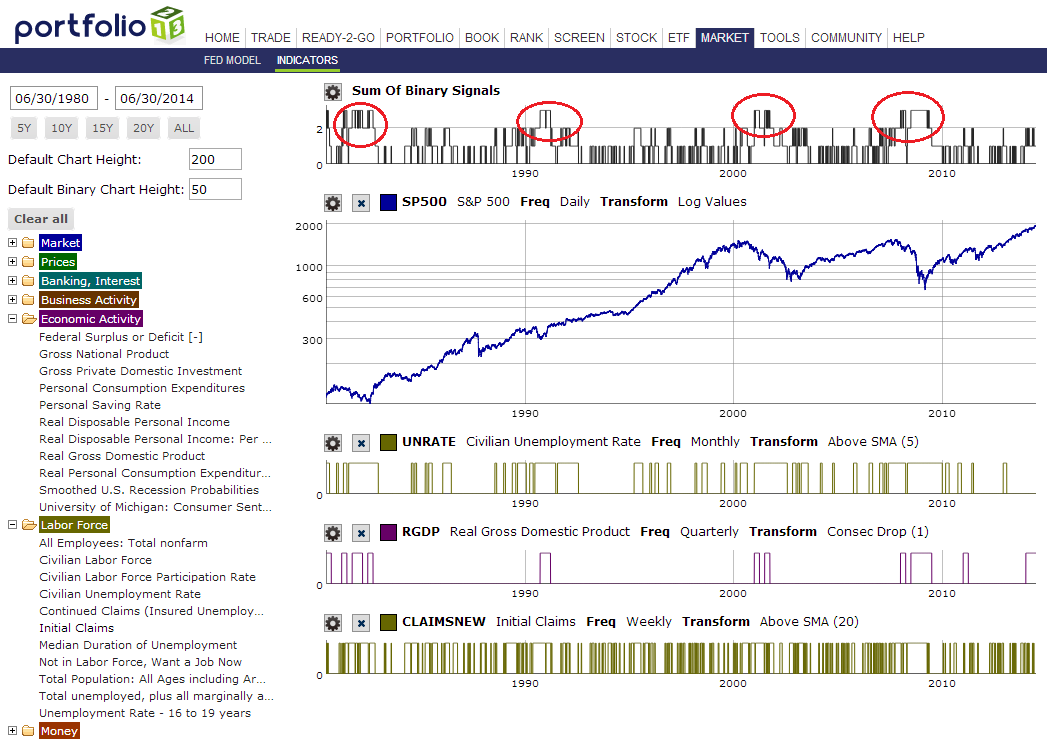
-when the monthly unemployment rate is above the 5 bar average
-when the quarterly GDP is lower than previous value
-when the weekly Initial Claims is above the 20 bar average
And what if:
-you enter a short hedge when the above value is equal to 3 (all conditions are true) ?
-you exit the hedge when the above value is 1 or below
The MarketScore will allow you to backtest this market timing strategy.
In MARKET->INDICATORS we have a “playground” tool. It is not the actual MarketScore function that can be called upon from buy/sell/hedging rules. This play tool is also missing a lot of functionality like saving, and a backtest button. But Should give you a sense of where we are headed.
Below is an image of the system I described above. Notice how the highest values of the “Sum of Binary Signals” are around bear markets, and in some cases anticipating bear markets (not the '87 crash unfortunately). We will have a webinar soon about this tool when saving & backtesting is completed. Hopefully the interface is intuitive enough for now for you to re-create this example.
Very neat stuff, kudos!
Can you add basic File functions such as “Save”, “save As”, “Open”, “New” to allow working with these models outside of a trading system?
Cheers… Zvi
Has anybody noticed that FRED now only has 10 years of S&P 500 data. A few weeks ago one could get daily data back to the sixties. So this is not going to be particularly helpful to develop market timing strategies.
Also note that many indicators are not point in time. For example the May 2014 unemployment rate is listed as 6.3% on 5-1-2014, but it was reported on only later 6-6-2014. It is even worse for GDP which is reported 4-months after its listing date. So unless adjustments are made to the series dates to correspond to reported dates then the FRED indicators are almost useless for timing purposes.
The actual “MaketScore” tool, not yet implemented, will run backtests using point in time series from ALFRED. The graphical “playground” will remain as is, using the latest fully adjusted series. I doubt there will be much difference since this type of analysis is all about trends which revisions should not affect much. We’ll see.
Even before starting to build a market score, I suggest lining up various indicators (with or without transformations depending on how you want to view the indicator) one at a time under the SP 500 chart, and use the slicing vertical bar to study relationships between the indicators and the market.
Think of this as an electronic sketch pad or workbench. I don;t know of any other stock selection platform that has anything close to this (and i’ve been a FactSet user in the past as well as a user of EcoWin). While there is a general sense that economic information really ought to be relevant to market analysis, there is a void out there in terms of how to relate them, which you may or may not have already felt if you tired to work with the economic data we already posted to p123 a while back. What’s really needed is a way to see what relates to what and what doesn’t – something that needs to be considered even before one starts to build a model.
The usual temptation when trying to study things like this is to create a chart showing various time series. But given the different scales and different behavior of the various series, things can get very messy very quickly. What I’d been doing in the past was taking screen shots of a lot of graphs, trying to size them such as to have the time periods line up as best I could, and then placing them, literally, one on top of the other so I could start looking for relationships.
That was the starting point for this tool. Obviously, it’s already way beyond that with the scoring capability. But before going into that, you may want to simply do a lot of visual examination.
Also, make sure you click the settings icon. That’s where you’ll find the chart transformations (i.e. a chart that’s in units can be transformed into a growth-rates chart, etc.) as well as the scoring creation. Also, you can click on the FRED link and be taken to their site if you want to get more info on the indicator. Notice, too, in settings, the position. You can change this in order to alter the top-to-bottom presentation sequence.
Great addition, and something that may be of interest to institutional investors as well. Agreed with Marc that the tools on P123 would rival other (much more expensive) platforms.
Just came across something in a research document I’m reading that might be of interest in connection with Market Score:
"We also show that the returns-fundamentals relation is considerably strengthened when it is conditioned on macroeconomic variables, thereby demonstrating thereby demonstrating the importance of a contextual capital market analysis. For example, several fundamentals that appear only weakly value-relevant or even irrelevant in the unconditional analysis exhibit strong association with returns under specific economic conditions . . . . "
Lots of interesting and potentially productive ways for this to evolve.
I would like to quote Olikea here: “Markets are not efficient, they are competitive.”
Depending on liquidity/capacity of trading startegies, there is more or less competition.
Market timing is the most liquid and competitive next to FX.
So we are up against the big boys on this playing field.
No inefficient/uncompetitive small/micro cap niche.
But thanks to this new upcoming feature, we can start making statistically more relvant conclusions. (65 years vs. 15 years of data)
P123 is great and is getting even better every day!!!
Scott, you can by adding an indicator then applying a binary “transformation”, like above moving average of past 20 bars. If a binary transformation exists a “combined binary score” graph also is displayed. The sum of all binary transformation is the overall score that ranges from 0 (all binary transformation evaluate to false or 0 ) to N , where N is the total number of binary transformation all evaluating to true or 1.
Coming soon …
Ability to save your chart setup
Ability to backtest based on the score right on the indicators page
Ability to reference a point-in-time market score from buy/sell/hedge rules