My simulation lost 25% in 2011 although 2008/2009/2010 is fine.
My bench is russell 2000 (it lost 7-8 % in 2011)
Any ideas on buy/rules to add ?
regards
My simulation lost 25% in 2011 although 2008/2009/2010 is fine.
My bench is russell 2000 (it lost 7-8 % in 2011)
Any ideas on buy/rules to add ?
regards
This screen simulating an equal weight Russell 2000 has a 32% drawdown in 2011! Assuming that you are limiting your stock pricks to those from the Russell 2000 your screen actually beat the true benchmark. However, the question is a good one.
I would suggest that you start learning technical analysis. That’s assuming (from your post) that you don’t use TA risk-mitigation techniques. I decided to dive into it when I took a similar loss in 2006. That was a good decision, because I was able to gain 120% during the 2008 crash when everyone else lost 50% (and many lost a lot more).
There are a lot of sources for TA out there, but I would suggest (at least a trial) subscription to InvestorsIntelligence.com newsletter. I have been able to learn a lot and avoid major drawdowns by following the advice of founder John Gray. Investors Intelligence has been around since the 1940s and is highly regarded in the investment community.
Use this link to get a free 30-day trial, and my website will get a spiff if you join: Investors Intelligence - technical analysis of stocks, ETFs, currencies and commodities
They are well known for their Wednesday ‘Advisors Sentiment’ publication, which you can also get a free 30-day trial to at this link: Investors Intelligence - technical analysis of stocks, ETFs, currencies and commodities
Another good source is StockCharts.com, but you’ll have to subscribe to get the good stuff. Besides the charts and ChartSchool, they publish a daily market alert that is very good if you subscribe.
I’d like to resurrect this topic. The original question is a very good one. And it’s not that technical analysis isn’t relevant. I believe it’s very relevant for this event.
The event in question was S&P downgrading the US Credit Rating for the first time in History. This one event was the catalyst for a selloff that was already in the works. I’ve been racking my brain and my fledgling P123 experience to try to figure out what indicator’s there were in August 2011 that could be used to trigger a sell or a hedge. I’ve tried using VIX as a indicator as it was trending higher for at least the 30-bar period leading up to 8/5/11. But, it doesn’t go beyond 30 (the general rule) until 8/4. So in a port, how would you go about building a sell rule using this and perhaps a combination of several others? And building the rules in such a way as it would trigger a sell prior to the end of that 30-bar period assuming you had at least one port rebalancing during that timeframe?
I suspect the websites mentioned by IntelegentValue use this same methodology. They’ve got a bunch of Wall Street techies staring at a live screen all-day-every-day. When their indicator dashboard turns red they fire off an email alert. Not a bad service, just beyond the scope of P123.
Even if you could match that here, Ports only sample the market at most every week. And if you’re really fancy combining several ports, once per day and with data that even for point in time is at best measured at the end of the trading day, useable the morning of the next open.
Any ideas would be appreciated.
There is no way for a model to predict a market downturn that was precipitated by disagreements in US Congress, which resulted in S&P downgrading the US Credit Rating for the first time in history. Don’t even try to find parameters that may have predicted this downturn, because there are none.
Didn’t the potential splitting up of the EU through countries default also play a role? I think that was a big story as well. It would have been very disruptive to not only EU companies but SP500 as well since they derive so much profit from that region. I don’t know how one can model a hedge strategy for that either.
US Government long bonds would have made a great hedge in 2011 during the European credit crisis just as they were great in 2008 during the financial credit crisis and in 1998 during the Asian credit crisis.
What these three crisis had in common was a spike in credit risk for some of the riskier bonds.
A faster but simple technical system could have avoided much of this draw down but would be prone to whipsaws. This over time will likely result in a greater total loss. You could also data mine a more complex system that would have avoided much of the 2011 draw down, not have frequent whipsaws, but would have sub optimal performance out of sample as it likely will have too many parameters for the data set. The best strategy for 2011 may have been keeping a longer rather than a shorter term perspective (2011 had a painful draw down but recovered by the end of the year) and have less capital in stocks (50% in bonds and/or cash will cut your draw down by at least 50%).
Scott
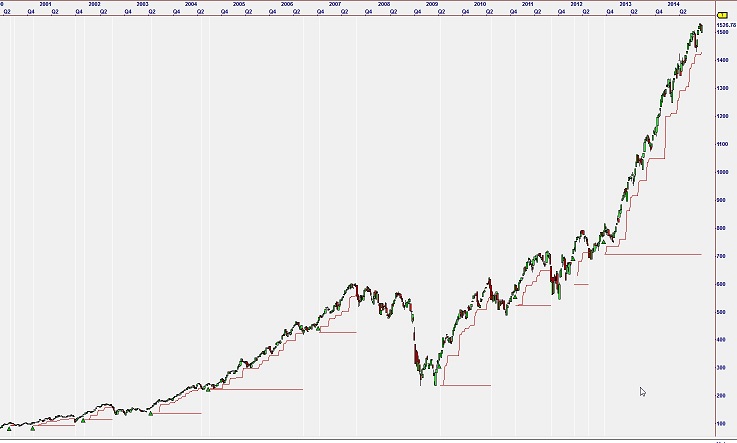
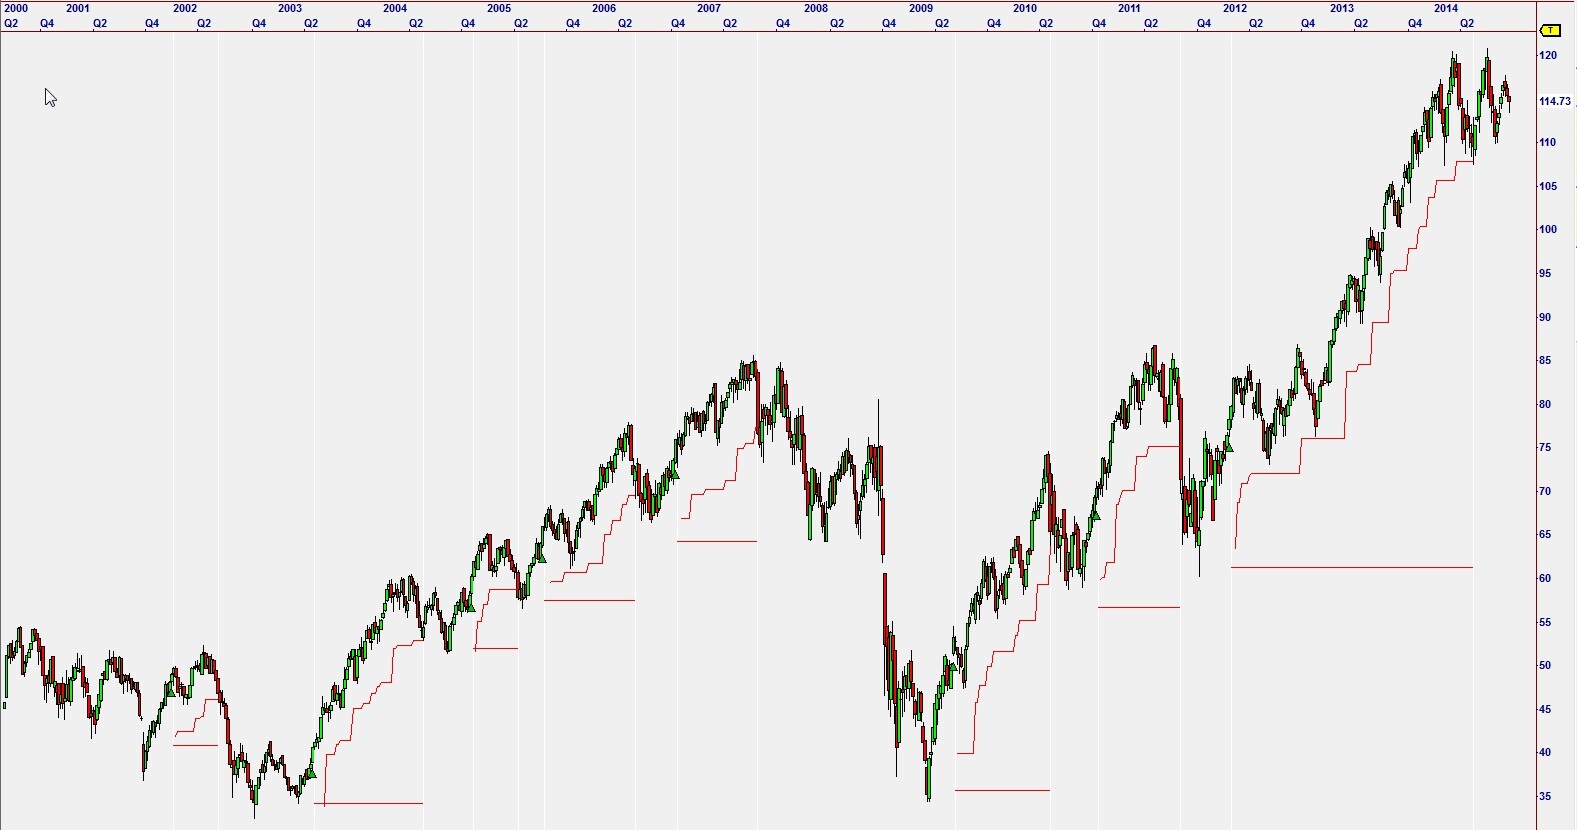
Try simple technical analysis of the equity curve.
The first screenshot is of a 25 stock RTG, weekly bars, a simple channel breakout entry and a trailing stop. The second is the same method applied to the Russell 2000 (IWM).
IMO avoiding historical drawdowns isn’t always a great idea. Be carefule not to overly retrofit your system to past data. The next ‘crisis’ will look completely different.
I totally agree with the skeptics here.
Don’t even try to avoid drawdowns in past simulations. This will most likely fall apart in the future.
I’m with those that think the question is a good one. The issue of over-fitting that the skeptics raise is also good.
Bill
It’s a great question but one for which I’ve found no answer, despite much effort. As noted in a prior post, that drawdown was based entirely on a news-oriented catalyst. So there was no fundamental indicator that could have caught it before the fact (although I suppose a sufficiently diligent data miner could come up with something after the fact). So generally, this is the province of technical analysis, but this particular drawdown occurred so rapidly, even the most well-conceived rules would have failed had you not rebalanced within an incredibly narrow window (I don’t recall exactly but I think it was just a day or two).
The bottom line: As learned through Long-Term Capital Management, the rocket scientists who flocked to Wall Street quant departments in the 2000s, and many others including some Nobel Prize winners, you can mitigate risk, but you can’t eliminate it. If you are going to be in equities, you bear the risk of occasional big drawdowns; case closed. And you can never quant your way out of the need to watch and understand what’s happening in the financial markets: That’s the only way you can assess the potential for a big melt-down to be followed by a big melt-up, as we saw post-2001, post-2008 and post 2011 and countless other times. (Actually, I need to modify my dismissal of quant analysis here; statistically, the melt-up has occurred 100% of the time with varying time frames; you need judgment to determine whether it’s different this time or whether the time frame this time will be too prolonged – I’d hate to see a big crash in 217 that gets rectified and then some, in 2062).
Maybe my “me too” does not add very much but I too have found (after extensive testing) that technical rules were not the answer for a 2011 type event. My best solution so far is to either have some percentage of my portfolio in a uncorrelated asset class such as bonds or to accept volatility.
Having some short positions as part of your portfolio would help as well as bonds etc. But it also means giving up alpha on the way up.
The problem with July 2011 was that both stocks & bonds went down because it was due to USA credit rating downgrade. Only short etfs or positions would have helped at that time but the long term cost of that can be pretty high. It is very hard to develop a system for that kind of “one off” event. 9/11 would have been a similar problem. Most people do not realize that 9/11 does not show up if you use most of the common market timing systems because the market was already in a downturn at the time. So most of the systems will have you in cash or hedge at that time but that is just a coincidence.
KJ
I believe the 2011 could have been approached in retrospect with monetary and economic screens. In 2011 the world wide leading indicators did plunge into the recession zone in advance of the market and we had and end to the 2011 form of QE. That set up is somewhat similar to what we have today.
I have a macro chart that appears to miss the entire 2011 drawdown. Sheer luck, since I spent no more than 5 minutes developing it. Not sure how to post a link but it’s public in my folder. Called “SP%200&Unemployment”.
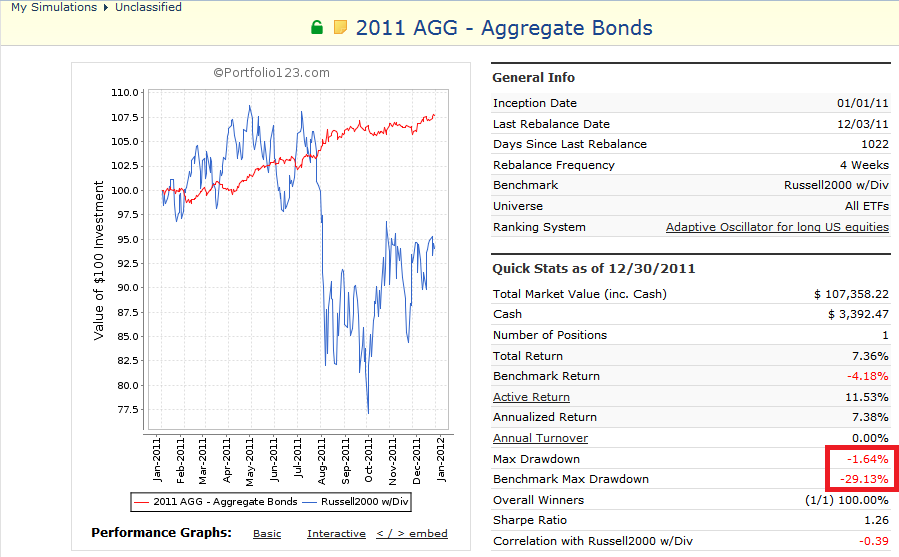
In 2011 the AGG ETF which is the aggregate bond market was up 7% with a drawdown of 1.6%. See this portfolio .
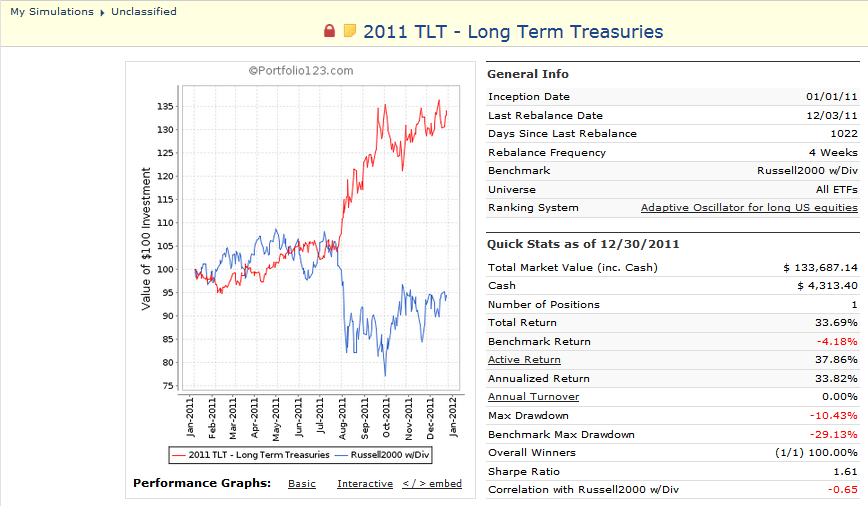
And here is the perfect hedge in 2011; safe haven US Treasuries! Hedges don’t get much better than this! Portfolio is here. Of course TLT does have it’s issues and will not always be a perfect hedge every time but it’s certainly useful.