With recent talk about large vs. small ports, I decided I would make the case for diversification. If you disagree please do say; I thrive on considering viewpoints and counter viewpoints.
Here is my arguement:
Scientifically, to be confident of a result, it has to be “statistically significant”. Every result which has been measured is subject to errors, which have to be considered: If the error is too large relative to the observation, then little conclusions can be drawn.
This applies to ranking systems and indeed real time performance and simulation. There are two obvious sources of “error” why real time performance may not match future performance:
- Benefit of hindsight while constructing ranking system; look-ahead bias
- Change of market conditions: factors falling out of favour (RE: Price2Sales).
There are then the less obvious sources of “error”, and these are the effects of the randomness of stocks. However, unlike the above two errors, which are systematic and unkown, the “random error” problem is more tractable. Unfortunately, “random errors” creep in twice:
- In the construction of the ranking system
- In the real time use of the ranking system.
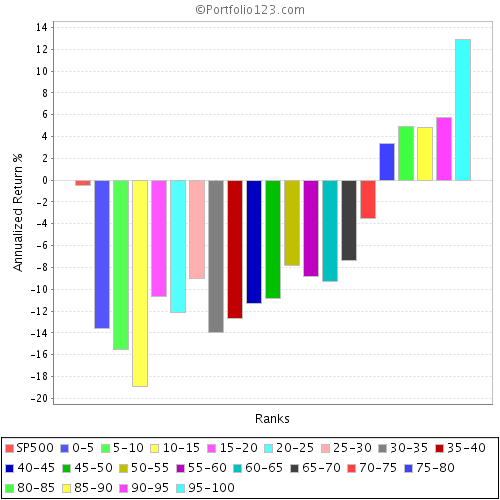
To illustrate the point of random errors, I have created a “random” ranking system, and ranked using my minimum liquidity prescreen. This is a universe of just under 5,000 stocks.
The “random” ranking system is useful, because it allows us to construct “dartboard portfolios”. This is akin to selecting your portfolio by putting tickers on a wall and throwing darts at it, this is akin to the acedemic “random portfolio”.
Now, I did some tests, and an equal weighted porfolio of all stocks in the minimum liquidity universe has returned about 10.25% per annum since March 2001. Please note that this is greater than the return of the S&P500 but the latter index is not equally weighted, with large companies dominating the return of the index.
My question is this: Given the dartboard portfolio, how close can you get to the “average” return, and more specifically, how likely are you to not achieve a substandard return?
Quite often, one looks at (the admittedly arbitrary) 95% confidence level, so I want to ask, for any given portfolio size of stocks, what level of return below the “average” return do I have a 95% confidence of achieving; specifically, in percentage terms, how far below the average return can a portfolio deviate within 95% confidence?
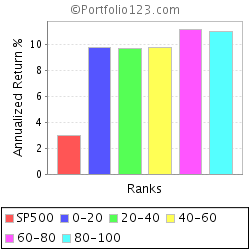
First of all, look at the random ranking system with 5 buckets. Each “porfolio” reprents 1000 stocks being churned every 4 weeks (as with all the others). There is some variation but every bucket is pretty close to the average 10% return. To see the 95% confidence, you would have to look at the bucket that is in the top of the worst performing 5% of buckets - obviously not possible with 5 buckets, but possible with 20 or more buckets.
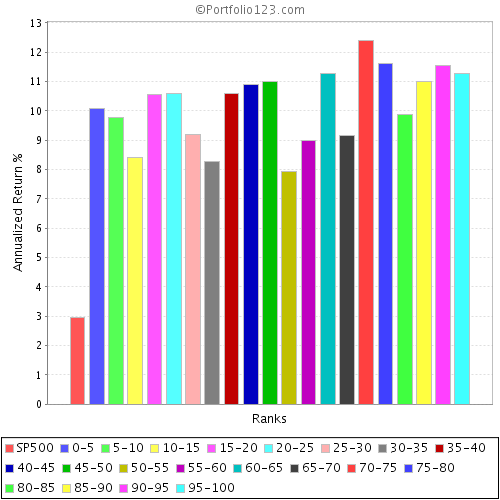
Now look at the system with 20 buckets. Again this time, each bucket contains around 250 stocks, which is actually far more than is frequently considered “necessary” to be diversified. Yet despite this, look at the variation in performance. The bottom performing bucket has a return below 8% per annum, a full 2% below the average. Implication: Even with 250 stocks in the portfolio, the 95% confidence level suggest you could underperform by as much as 20% below the average rate of return! Put another way, there is a 5% risk your return is 20% below the average.
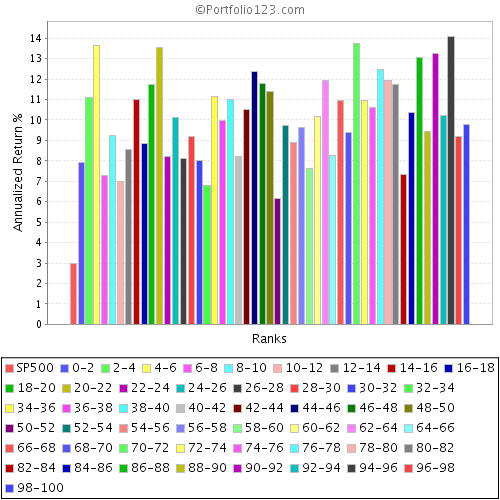
Now lets consider 50 buckets, the next picture down. To look at the 95% confidence level, I consider the 2nd worst performing bucket - a return of under 7%. With a (roughly) 100 stock portfolio, there is a 5% risk of underperforming by as much as 30% below the average.
Now 100 buckets (50 stocks per bucket): I look at the 4th worst performing bucket - a return of 4.5%, fully 55% below the average return!
Now 200 buckets (25 stocks per bucket): Look at the 9th worst performing bucket: - a return of just 2%, an incredible 80% below the average return!
Conclusion: 25 stocks is nowhere near enough to be statistically confident of an acceptable return. (let alone 3-5 stocks).
Now, these were random buckets, but if you imagine their performance in terms of “deviation from an index”, the results are infutable. If you have a ranking system that puts you into “value” because you believe “value” will outperform, then effectively your universe is now “all value stocks”. However, even if the index does well, your result may still be very poor due to random fluctuations, you need a large number of stocks to be statistically confident of achieving the good result, and outperforming the market.
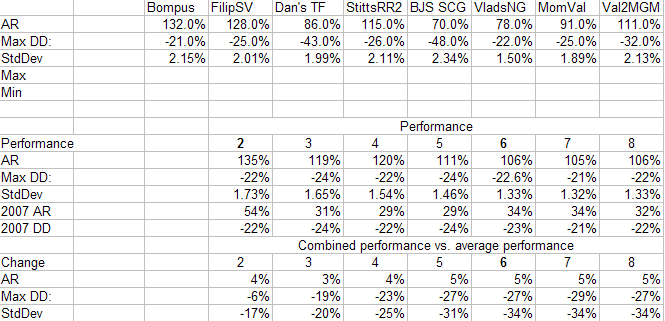
I believe this sort of effect explains why ranking systems such as TF12 don’t have their top performing bucket as 99-100 in 2007, but if you divide into 20 buckets, the top bucket retains its top performance.
Comments?