The following new functions are now available for Port/Sims:
HoldingsCnt(“MyListName”): Returns a count of stocks in the list that are current holdings CashPct: Returns the % of thecash in the port/sim vs. the total market value PortCash: Returns the amount of cash in the port/sim TotMktVal: Returns the total value of the port/sim (incl. cash)
You can find these functions in Buy/Sell rules under FUNCTIONS->PORTFOLIO
We also added a new ‘series’ parameter to ChaikinTrend so that you can calculate it for something other than the current stock being analyzed, like the benchmark or an etf, etc. Possible uses could be for market timing.
Now that P123 has allowed portfolio omphaloskepsis perhaps it’s time to revisit this six-year old feature request. Of the 425 open requests, it ranks #8 in Total Score.
Item 3 in that request is apropos now that the suggested function “NumHoldings” has been implemented (As “HoldingsCnt”):
That’s a great word (had to google it). But actually these functions were very easy to add (literally 15min) and a couple of long time users were requesting them personally for a while. Not sure that is omphaloskepsis…
In any event we know we have a long list of requests. Our current priority is to do our own ratios so we don’t depend on reuters for them. Ratios are not a priority for them, but they are for us. We need control of them and not be at their mercy. The other main project in parallel is including dividends, then short sims. Hopefully you all agree those are foundations for a much better platform.
Once these are done we will go back and see each and everyone of the feature requests. But if there is something you really want give us a call. If it’s easy we will do it.
My thought was that you are allowing a portfolio to contemplate itself.
BTW, many years ago in an important interview, I was asked if I knew what the term meant. Oddly, I did … but that was not enough to overcome the Rhodes Scholarship committee’s aversion to people from military academies, and so I did not get the Oxford gig.
While we’re on the topic of implemented feature requests I’m wondering if there is currently a way to reference the open price at the beginning of the week or month? I see there is a MonthDay function so it occurred to me that something like Open(MonthDay-1) might work but then my idea would seem to come to naught if I also wanted to reference the opening price of the previous month so I didn’t check to see if it would actually work. Is there a way to do the above without actually having to count the number of bars that have passed since the beginning of the month or week?
Sterling, there’s no way to do that. You are looking for the price in the past right? MonthDay would not work because the parameter for the price functions is in bars (trading days)
How generic do you need this to be? Just beginning of month and week, or more flexible like: beginning of previous month, 2 months ago, end of month, etc.
Marco, while we are at that: Technical indicators work differently on different time frames, and weekly numbers (such as weekly averages etc) are important as they filter daily noise and show long-term trends better. We need P123 to provide key technicals on the weekly charts, especially considering that backtesting ranks are provided on a weekly basis.
I mostly felt the need for: Wekly SMA and EMA, but I think that we also need: OpenW,HiW,LowW and CloseW with a parameter of nWeeks, (i.e. CloseW (nWeeks ), Highest, Lowest, HighestBar and LowestBar, NoWeeks [it should be rounded up], PortWeeks, RSIW (nWeeks ), SharpeW (nWeeks ), VMAW, and VolW.
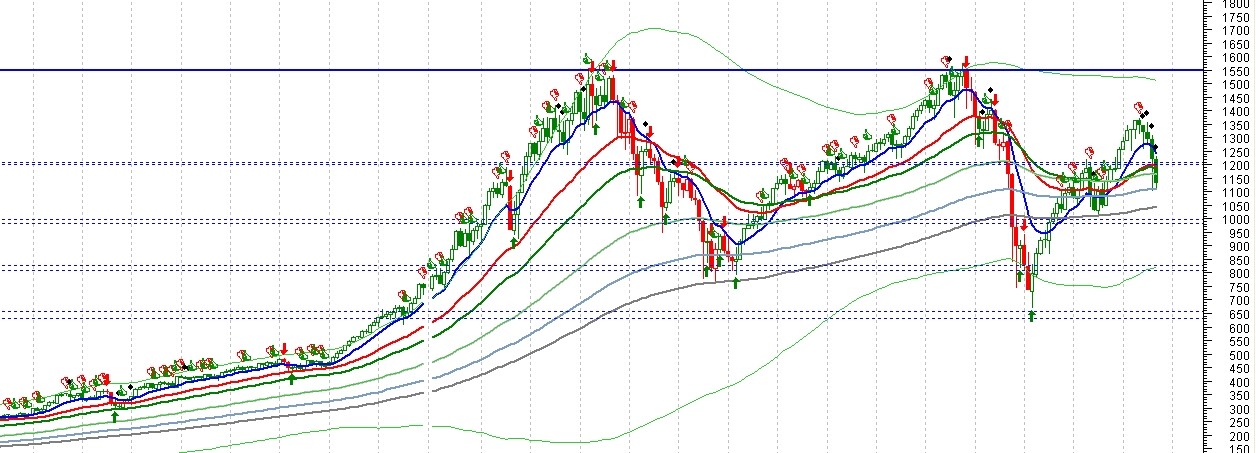
Multiple time frame analysis requires being able to compare signals on multiple time frames. Intraday data is understandably difficult but I imagine weekly and monthly should be relatively easy to access. For my own purposes being able to simply call upon OHLC data for the weekly and monthly time frame for the past 12 months would be sufficient, although making it more flexible would make sense. As for the value of the information in such higher time frame charts I would suggest taking a look at the monthly chart for the S&P 500.
Go to Tools; List, and there you can create a custom list of stocks you want buy from. Give your list a name. then using the buy rule; HoldingsCnt(“MyListName”), replace “MyListName” with the name of your new list. Don’t forget to include the quotes “".
I’m not trying to use a custom list. I thought this function was just to look at the current list of holdings and then return the count. Then the return number could be further used in the rule. As in,