What's in the bucket?

Marco, All:

I need help.

I’ve been a member for six weeks, and I’ve spent the first one hundred hours reading the threads that have been posted over the years. I’m extremely impressed with the intelligence, integrity and generosity of the community, and wish to express my gratitude to all who have shared their experiences here.

The problem I have seems to be a common one among newcomers: What’s in the bucket?

I ranked the Dow 30 by MktCap and set my Historical Performance Graph to output 30 buckets, thinking I should get one stock per bucket. I ended up with seven empty buckets. I thought the problem might be NAs or Final Statement Ns, but Johnson and Johnson was the only culprit, with one N. Nevertheless, I built three more universes of 30 stocks each, careful to ensure zero NAs and Ns, and I also ranked by another single factor, StockID, and also by a simple Ranking System named Momentum.

Not only did all my rankings return seven empty buckets, but they were always the same seven, counting from left to right: 6,11,14,21,24,27, and 30. Trying to simplify, I built universes of two stocks, three stocks, four stocks, etc., all the way up to 20, and then ranked using single factor Ranking Systems, matching the number of buckets with the number of stocks in the universe.

Universes containing two to ten stocks filled their respective matching buckets, but starting with my Eleven Stock Universe, things got weird, as they were with my 30 stock experiments.

For those of you who may wish to try replicating my results, here are the particulars:

Eleven Stock Universe: Buckets 6 and 11 Empty
Thirteen Stock Universe: Bucket 10 Empty
Fourteen Stock Universe: Buckets 10,12, and 14 Empty
Fifteen Stock Universe: Buckets 6,11, and 14 Empty
Seventeen Stock Universe: Buckets 12, and 16 Empty
Nineteen Stock Universe: Buckets 10,14,16 and 19 Empty

At one point I ran a Simulation on a five stock universe, using the same criteria I’d used on the Ranking, then turned to the Transactions:All section and calculated the return in the lowest bucket through four quarterly rebalances. The lone stock in the bucket changed at two different rebalances, and my computation of the Annualized Return matched the return shown for that bucket at the bottom of the Ranking>>Performance>>LOG Processing readout, which was great. I understand how that works now. The gain or loss in each bucket for a given period (3 months in this case) is calculated and added to the remaining periods; that number is then divided by the number of periods (4 in my experiment) to get the average return per period; finally, the average periodic return is “compounded” to arrive at the Annualized Return.

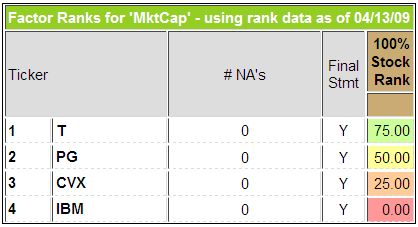
I am not able to conduct a similar test running a Sim using a Thirty Stock Universe because I buy 30 stocks at the inception and can’t identify what stock is or is not in an empty bucket. It doesn’t seem to matter how many rebalance periods I use, or the overall length of time the Sim or Ranking System runs. I still end up with seven empties. See the attachments. (If I can figure out how to attach them).

What Up?

(A Different) Denny


Denny,

Your problem is caused because you do not have enough stocks in your universe to have a stocks distributed into each buckets. The buckets divide the RANKS of the stocks into even ranges. In other words, if you use 20 buckets, you will get the stocks placed into 5% ranges based on the stock’s Rank value. So, 2 stocks that have the same (or close to the same) Rank value will be in the same bucket. The stocks themselves, due to the factors selected in the Ranking System, will have rank values clustered into various ranges with no stocks having a rank value in other ranges. The buckets are not based on dividing the stocks evenly, but on dividing the stocks’ Rank values evenly.

(The original) Denny :sunglasses:

PS: Welcome to P123!

Denny,

Thank you for taking the time to answer my post. I agree with you that “…if you use 20 buckets, you will get the stocks placed into 5% ranges based on the stock’s Rank value. So, 2 stocks that have the same (or close to the same) Rank value will be in the same bucket.”

That proves to be the case when I use a 20 stock Universe, although none of the stocks have the same value so none of them share a bucket. The model breaks down elsewhere. The model predicts that if you use 30 buckets, you will get the stocks placed into 3.33% ranges based on the stock’s Rank value. Alas, that doesn’t happen, even though none of the stocks have the same (or close to the same) Rank value.

I am flummoxed.
I see a stock with a number. The number is 96.67.
I see a bucket with a range. The range is 96-100.
The number 96.67 falls within the range 96-100.
The stock doesn’t.
The mind is repelled.

I have invested far too many hours grappling with this issue already, and I am about to move on dot org, resigned to the fact that I don’t quite get it and possibly never will, but before throwing in the towel, let me ask you to dig deeper with me, looking at the problem through “beginner’s eyes” one more time.

I want to be as precise in my terminology as possible so I begin with an explanation of how Stock Ranks are labeled, as I understand it, without regard to buckets, bucket labels, bucket size, number of buckets, etc. This borders on the tedious, and I know you already know the material, but I ask your indulgence as I try to paint the picture at my level.

I’ll calculate Rank Values for a 4 Stock Universe, a 30 Stock Universe, a 500 Stock Universe, and a 7869 Stock Universe (the number of stocks available in the All Stocks Universe as I write these words) to demonstrate that I understand the math.

4 Rank Values (See attachment)
100/4 = 25 (The Subtrahend)
100-25=75= T
75 – 25=50= PG
50 – 25=25= CVX
25 – 25=0= IBM
Four stocks, each with a specific rank, and no mention yet of whether I intend to have these distributed in 2 buckets, 200 buckets, or somewhere in between.

30 Rank Values
100/30 = 3.33 (The Subtrahend)
100 - 3.33=96.67= XOM
96.67 - 3.33=93.33=WMT
93.33 -3.33=90.00=MSFT
90.00 -3.33=86.67=T…etc.
I’ll return to this 30 Stock Universe momentarily.

500 Rank Values
100/500 = 0.2 (The Subtrahend)
100 - 0.2 =99.80=XOM
99.80-0.2=99.60=WMT
.
.
91.20-0.2=91.00=MMM, the 45th stock of 500.

7869 Rank Values
100/7869 = 0.012708095 (The Subtrahend) which rounds to 0.01 when only 2 decimal places are displayed, so…
100 – 0.01=99.99= XOM
99.99-0.01=well, 99.98, except 99.97 is the displayed value because the calculation is made using all nine internal decimal places, which is why we get an occasional “skip” of 0.02 instead of 0.01.

The larger point is, if you ask me to pin a Rank label on 3M now, I will tell you that MMM is ranked 101 of 7869 stocks, with a “normalized” value of 98.74.

Thanks for bearing with me through the minutia of Stock Rank labeling.

Bucket labels are calculated the same way, or course, except the smallest granulation is limited to 100/200 = 0.5, ergo:
100 – 0.5=99.5
99.5 - 0.5=99.0…etc.

Now let’s return to the 500 Stock Universe and determine which basket 3M ends up in when we examine a 5 bucket display, a 30 bucket display, and a 200 bucket display. MMM’s Rank Value in the 500 Stock Universe is 91.00, 45th from the top. I maintain the stock ends up in the 80-100 bucket at the far right of the attached chart when 5 bars are displayed, in the 90-93 bucket three from the right when 30 bars are displayed, and in the 91.0-91.5 bucket eighteen from the right when 200 bars are displayed.

So far, I’m a happy camper. Now I’m going to generate some heartburn. Look again at the 30 Rank Values attachment. Every stock has a unique Stock Rank. There are no ties. XOM is ranked first at 96.67. T is ranked fourth at 86.67. It seems perfectly reasonable to me that XOM and T would both go into the same bucket, labeled 80-100 on a 5 bucket chart, but that XOM would go into the bucket labeled 96.5-97.0 on the 200 bucket chart while T would end up in the 86.5-87.0 bucket on the same chart, and finally that XOM would go into the 96-100 far right bucket on the 30 bucket chart while T ended up fourth from the right on the same chart, in the 86-90 bucket.

Denny, you say I do not have enough stocks in my universe to have a stock distributed into each bucket. I have exactly 30 stocks and 30 buckets. The label on each stock maps directly to the label on one and only one bucket. As I see it, XOM, whose Stock Rank is 96.67, can only go into the bucket that holds stocks labeled 96-100. And where could the stock whose Rank is 86.67 (T) possibly go other than into the bucket labeled 86-90? But T, apparently, didn’t go there.

I agree with you that, given the right circumstances, stocks “…will have rank values clustered into various ranges…,” and I think I proved that, by clustering XOM and T into the 80-100 range on the 5 bucket chart. But I do not see any stocks in my 30 Stock Universe that can be clustered within the 30 bucket chart. Do you? Each Rank maps to a unique range.

It’s my contention that the following 7 stocks belong in the following 7 buckets, counting from Right to Left:

XOM Ranked 96.67, belongs in Bucket 1, labeled 96-100.
T Ranked 86.67, belongs in Bucket 4, labeled 86-90.
IBM Ranked 76.67, belongs in Bucket 7, labeled 76-80.
ORCL Ranked 66.67, belongs in Bucket 10 labeled 66-70.
ABT Ranked 43.33, belongs in Bucket 17 labeled 43.46.
WYE Ranked 33.33, belongs in Bucket 20 labeled 33-36.
MON Ranked 16.67, belongs in Bucket 25 labeled 16.20.

How could it be any other way? And yet these seven buckets are empty. If ORCL, for instance, is clustered with another stock, what stock is it, and in which bucket are they clustered?

It doesn’t matter if I rank by Price, MktCap, StockID, or Filip’s Super Value 92, The Magnificent Seven go bye-bye together every time.

I will not beat this dead horse again, but if there is a fly in the ointment of my reasoning, please help me pluck it loose.

Thank you.

Denny


4 Rank Values.JPG


Denny,

You are not crazy, you have stumbled onto a new “feature” with P123!
It looks like there is an error with certain settings using the Rank Performance tool. I ran a number of tests on what you were explaining. See my post under Errors in the Forum.

Denny :sunglasses:

Please see my followup on new thread http://www.portfolio123.com/mvnforum/viewthread?lastpage=yes&thread=3912

Thanks Denny and Marco,

I appreciate your efforts in this matter. This is a GREAT community!

denny