Equity Curve Timing

Hi,
Equity curve timing has been discussed before, but now that we have such an extreme bear market to show how systems can break down with the market, I thought it would be interesting to take a quick look at how equity curve timing compares to market timing.

I downloaded the daily returns of a couple sims and timed the equity curve as follows. For any Friday that the equity curve was below the 50 day ema of the equity curve, I excluded the following week’s return from the cumulative return. Since these were both sims with the exit rule rank < 101 each week starts with the top picks anyways. For the market timing rules I used the buy rules: benchclose(0) > sma(50,0,#bench) or benchclose(0) > sma(200,0,#bench) and BenchClose(0) / BenchClose(10) > 0.96.

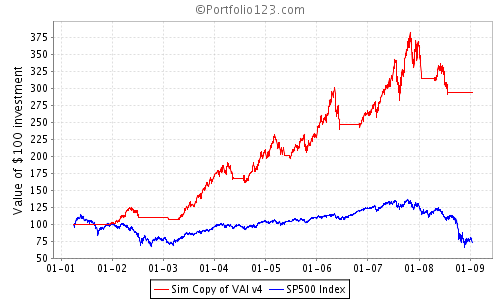
First sim is a 5 stock sim based on Filip’s Super Value:
http://www.portfolio123.com/port_summary.jsp?portid=346644

AR        DD      $100 Return
No timing           68.79%  -79.78%     5867
Market timing       88.53%  -23.09%    13868
Equity Curve Timing 88.06%  -22.89%    13597

Second sim is a 20 stock sim based on Filip’s Super Value:
http://www.portfolio123.com/port_summary.jsp?portid=343654

AR       DD     $100 Return
No timing	     69.33%   -59.39%     6023
Market timing        55.38%   -24.30%     3084
Equity Curve Timing  63.12%   -24.41%     4498

Seems very promising considering this was my first test and I did no optimization at all, and timing the equity curve can get you out when the market breaks down OR when the strategy breaks down. Also, the market timing rules often seem to have a negative impact on the annual returns of the larger sims. The equity curve timing did much better in this regard.

Anybody else using this, looking at this, want to confirm my results on other sims?

I think it would be useful to have access to the equity curve in the sim/ports for this purpose. Please vote for my feature request asking for access to the simple or exponential moving average of the equity curve here

and for a prior feature request asking for access to prior values of the equity curve, here

Don

Hi Dan. I agree this is a very appealing benefit.

I voted for the initial request and I will vote for the new exponential one as well.

I am glad to hear you did not do any optimization. To optimize you should have at least 30 data points to reduce the likelihood the optimization is fine tuning itself to the market “random noise” rather than to the market’s “repeating patterns”. If the goal is to avoid major market down turns, we have only 2 data points in P123’s data history (2001-2002 bear and 2007-present bear). So optimization will have a very difficult time differentiating between “random noise” and “repeating patterns”.

Regards,
Brian

Don,

How do you foresee a buy rule using the equity curve as an entry point? In your example, you just excluded 1 week of data from your excel data if your equity curve “sell rule” was below the 50 day ema of the equity curve. I don’t see a good way of setting up a buy rule to get back in.

For example, in Scott’s original request he proposed a Sell rule like; Equity(0) < 0.90 * Equity (30), and a buy rule like; Equity (0) > 0.91 * Equity (30). Using this approach, if the Equity Curve had fallen a little over 10 % over the last 30 days the Sim would sell. However, if the curve had fallen a little over 1% in the first week of the 30 days prior to the Sell, (and since the curve would be out of the market and flat over the next week) at the end of the next week the curve would be down less than 9% over the “new” past 30 days. This would cause the buy rule to buy back in even if the market was down 5% during this new week.

Also, it the Equity Curve was up for the first few weeks of the last 30 days and then fell over the last few weeks such that it was down over 10% for the 30 days, then the buy rule would not buy back in until the data from the first few weeks was no longer in the new 30 weeks data, independent of what the Market did. I think you see the problem here.

It seems to me that there needs to be a combination of Market timing and Equity Curve timing in both the buy and sell rules to make this work well. Anyone have any ideas?

Denny :sunglasses:

The only way to do equity curve timing is to maintain two system equity curves: (1) always in the market and used for the timing; (2) the real port equity that switches in and out of the market.

Steve

Hi,
For ports, I envisioned using the equity curve average as a signal to exit my real trades, but that I would let the port stay invested so it could be used as a signal to get back in.

To actually use this for buy and sell orders in sims and ports is more complicated. As Steve suggested, it would require tracking two separate equity curves.

I was thinking it might be interesting to make the rule to only sell if the equity is below it’s average and the benchmark is below it’s average. This loses some of the advantage equity curve timing would have in detecting a system that is breaking down, but might be good for robust sims/ports.

Don

Don:

I thought about this quite a bit last month and have done some backtesting. I used two models as Steve suggests. I ran a sim to maintain an equity curve. I then ran a sim that exited the market and re-entered based on an equity curve rule.

I wanted to limit big drawdowns in a daily pullback model. I was able to significantly limit most high drawdown periods. I followed a rule that sold if the port was down 10% and reinvested when it recovered. The graphs are shown below.

Here is how I backtested. I downloaded the data from the graphs page of the sim to excel. Then I manually identified the 10% drawdown dates and re-entry points according to my rule. This allowed me to develop an exposure list that had me out of the market and back in according to the signals from the equity curve. Running the sim again with the exposure list gave me the results of applying my rule. The results were good enough to convince me that there was promise in using a model’s equity curve as a benchmark timing mechanism.

If you think about it, we all follow a model and expect that it will gain in value, experience periods when it declines, and then recover. One tries to identify benchmarks that can be used to stay out of the market when the model does not work. I think we are really trying to find a benchmark that will predict when the model does not work. Isn’t the model capable of telling us when it doesn’t work? If one follows the model and times investments according to the equity curve, it seems to me that it should work better than other index based benchmarks. I don’t expect “model timing” or equity curve timing to improve sim returns that much but it should be able to limit risk.

Glenn

PS - The testing was somewhat tedious as you can guess. I learned that the MAX and VLOOKUP functions in excel make things a bit easier if anyone decides to try this. Also, I found that re-entry when the model recovered to its original high water mark worked better than getting in when it was back to the exit point. Finally, intellectual honesty is required to make sure you exit after you have had a 10% drawdown, not on the day it occurs; no peeking. This is the reason for the higher than 10% drawdowns.


Hi,
Glenn, thanks. Not the holy grail but I think this is another tool that can be used to limit risk. I just never got around to taking a good look at it before.

I ran a couple more tests. Results were also very good. For the larger, 20 stock sims it seemed to work better to use a slower moving average. This probably makes sense since these tend to have a smoother equity curve and don’t need timing as much as the smaller sims/ports. Still haven’t combined market timing w/ equity curve timing.

Don


There is a quickly implementable feature to eliminate some of the drudgery for equity curve trading, I added the following feature request here

http://www.portfolio123.com/feature_request.jsp?view=&cat=-1&featureReqID=654

Please vote!

Thanks,
Carl

Great thread. I voted for your request, Carl. One other thing I’ve looked at in the past (in a different context; still thinking about how to implement in P123) is to use the difference in the equity curve generated by the system and the one generated by the benchmark. This allows one to identify style shifts as well as factor fade. Instead of employing a moving average, employ an oscillator instead (e.g. RSI) that looks for times when the equity curve difference is “overbought” or “oversold.” One can then develop an exposure list according to this schedule. Just more food for thought.

Ted

I’ve been toying with Equity Curve Timing for some time. I typically download chart data to excel, and do some manual data manipulation using the chart data, and moving average timing to give me gain, DD etc. Does anyone have a good excel script they are willing to share that will output this pertinent data? I am considering purchasing Amibroker. I believe Amibroker will allow you to apply many indicators to the downloaded chart data, with an added optimizer tool. Very reasonably priced.

Stu

Stu:

I have one that I will post as soon as I clean it up a bit. Probably tonight.

Glenn

Thanks Glenn,

I look forward to seeing it.

Stu

All:

I posted here a model I liked back in September because it was remarkably “correction” resistant. Alas, it was not “Super Bear” resistant and got “smashed”.

Using the same model here and running it current shows a 69% annual return with a -47% drawdown. Not good.

When I used Equity Curve timing the results improved as shown here - 67% annual return and -21% drawdown.

The ModelTiming spreadsheet I used makes testing much easier. A copy is attached. You download the data from P123, select a drawdown level and the spreadsheet shows the exit and re-entry dates. Copy the dates to an exposure list and re-run the model with the exposure list. There are instructions in the spreadsheet.

I think the spreadsheet works correctly but let me know if there are any mistakes. If anyone has a better idea or improvements please share them.

Glenn


ModelTiming CreateExposureList.xls (1.52 MB)

Hi,
If you get out when the drawdown is -15%, when do you get back in? When it goes back above -15%? Some sims have a long ways to go to get back to that level. I tried combining the drawdown with the equity curve in my spreadsheet and attached. For your sim, getting out only when the DD is < -15% AND when the equity curve is below the 50ema of the equity curve, on daily basis I get AR 67%, DD -22%. Doing the same only exiting for at least a week at a time I get: AR 69%, DD -30%. The biggest difference is that the equity curve is close to it’s 50 ema, so it could get back in soon.

I also added in an ema of the benchmark and tried a run that way with the weekly. For your sim it had a drawdown in 2005 that the benchmark did not, so results were worse.

This spreadsheet is quick and dirty and the download from P123 can be copied right in if the data range matches what is already there, otherwise the sheet requires some minor adjustments… For the weekly, I get out when the prior day was a Friday, the 1 day ema (same as the daily close) is less then the 50 day ema, and the drawdown is less then 15%. If it is a shortened week, ending on a Thurday, week of 9/11, etc. the signal can be missed and the data should be reviewed manually. I did this in my initial tests and generally only caught 1 or less errors which had little overall impact.

I think the idea to set up an exposure list and retest in P123 is a good idea. Some sims will select different stocks if you get out and then back in.

Don.


EquityCurveTiming2.xls (1.75 MB)

Thanks Glenn and All,

I have been playing around with this Equity Curve idea for awhile. Please see the attached files. The dark chart if from a software package that I imported the equity curve info from the VAI V4 simulation. The other is a screen shot of the simulation after constructing an exposure list based on MA crossover on the original equity curve. In addition, on the dark chart, there are sub-charts. The white line is the in/out indicator, and the bottom chart is a Bollinger Band of the Equity Curve itself.

This is just scratching the surface on the types of technical indicators one could bring to bear on an equity curve. And even though the derived exposure list improves the sim substantially, I can get much better results doing forms of market timing/sector timing. Initially, I believe this says that pure Beta risk is much more important than style or factor risk, which probably should come as no surprise. More food for thought.

Ted


341946_3545.png

Here is the other file.


vai v4 equity curve.wmf (263 KB)

Hi Stu,

Regarding Amibroker - don’t hesitate.

Full featured (backtester, programming language, charting, automated trading interface to IB, more)
Programming AFL is like programming C (either too much power for some or just right for others)
Can be intimidating, but basics are very doable
Free data download from Yahoo, or cheap (30US$/mo) for Quotesplus
Regular addition of new features
Has cool stuff like

Correlation function
Ranking (not P123 style, but Mutual Fund relative strength style)
Walkforward testing (haven’t used this one yet but it is in there)

Bottom line, compared to Wealthlab (owned by Fidelity and requires their account) and to TradeStation (expensive) it is a value and a gem.

Sorry for the effusive testimonial. I have no financial interest in this tool. And for what its worth, I find P123 to be a much better source of investing profits. But for technical analysis, and specifically for equity curve analysis, this is a hard tool to beat.

And Ted, thanks for the vote.

Carl

Thanks Carl and Glenn,

I will purchase Amibroker. Do you own the pro or standard version? And I’ll have a chance to try Glenn’s spreadsheet in the next day or two.

Stu

I own the pro version. I only use EOD data, while the big feature on Pro is to use real time data. In reality I probably only need the standard edition.

Stu:

Carl is right. Unless you want to use real time tick data, all you need is the Standard version of Amibroker. My rough guess is that the Standard version has 99.5% of the functionality of the Pro version. The Standard version uses the same program file as the Pro version, the only difference being the “key” which the developer emails you for activation. When I upgraded from Std to Pro that was all that changed - he just emailed me a new key to unlock the additional features.

Although I think there are a couple of minor supplemental reports on back testing (ie, a chart showing the frequency distribution of trades by size of loss or gain ie, -5%, -3%, -1% 1%, 3% etc), the only significant difference is the ability of the Pro version to handle real time data ticks. I never got around to using the tick feature so I could have just stayed with the Std version.

Regards,
Brian