More than 7 years data - a temporary work around

Marco:

This thread is temporary. It will become unnecessary once Portfolio123 has its history extended to 15 years.

I do not consider this thread to be promoting a competing product because:

  1. backtest.org does not provide current stock picks. Its data is only current to January 2007.
  2. backtest.org’s lack of features, compared to P123, means no one will give up P123 to use backtest.org

The purpose of using backtest.org is to do “proof of concept” testing for 15 years of data that P123 does not have. This will let us see if the basic concepts of strategy ideas worked over the years 1986-2001 for which we do not currently have data in P123.

I hope you will not delete this thread until the extended history is available.

But this is your website and ultimately you can decide to delete this thread.

Brian (o806)

olikea:

Thanks for the tip. Backtest.org looks like can fill an gap until P123 releases its extended database. I have some questions I hope you can answer since backtest.org website is a bit confusing. I have spent sometime exploring their website and can not get answers to the following.

1 - Does the backtest.org database include delisted stocks or does it have a survivorship bias?

2 - Does backtest.org have a page that explains what each of the built in screens are? The only set of descriptions I have so far found is on the mechinv.org site and is called ScreenDefs.xls. That file is near the end of the list (the one that is 151K in size). The screen definitions are on the 2nd page of the Excel workbook. Here is the URL: http://mechinv.org/files/TheGreatRadish/RadiScreen/
I would prefer to use definitions straight from backtest.org rather than a 3rd party website. But I just can not find the appropriate link.

3 - A lot of the built in screens use ValueLine’s “Timeliness” ranking. Is there an approximation for this in P123? Or should I be learning the rather dense scripting/programming language of backtest.org to build my own screens without Valueline’s Timeliness factors? My only interest in backtest.org is to do some “proof of concept” back test. I really do not want to spent a lot of time learning the detailed codes with its confusingly dense scripting syntax since it will likely become redundant when P123 releases its extended history.

Any guidance you could give would be much appreciated.

Brian (o806)

Please understand - backtest.org is a poor substitute for p123 as it only allows you to test basic screens and one dimensional ranking. Also, if you look in the field guide, a number of factors are not available on data prior to 1997, such as price-to-sales ratio.

The site really is a partner with the “mechanical investing” community on the motley fool. For more information, and some defintions for their screens, see:

http://boards.fool.com/Message.asp?mid=14908629

You can create your own screen to test, simply go here: http://www.backtest.org/SB

Then you can use the field guide ( http://backtest.org/vlfields.html ) to understand what fields are available.

To screen, there are instructions on the site, but to get started, simple rules like “top 20” buys the top 20 stocks, or “top 20%” buys the top 20%. The rules are applied cummulatively, starting at the top and working down.

As for the database: This is from valueline, and I do believe it is point-in-time as they have been around for a long time. But I don’t know for sure.


Now, as for the “Timeliness” factor: This is enough to start a whole new thread! Timeliness is a propietry quantitative measure by valueline on the appreciation potential over the next 12 months, ranked 1 (best) to 5 (worst). With data going back to 1965, the bucket ranked 1 has returned 25,000% (14% annual), whereas the bucket ranked 5 has returned 540% (4.5% annual). See: http://www.valueline.com/why_use_how.html

Unlike some other promotional materials out there, the performance is “real” and has been audited in real time, and as a result this arguably provides “proof” that the market is not efficient, and has caused a stir in some acedemic circles (see: http://links.jstor.org/sici?sici=0022-1090(200009)35%3A3<485%3ATVLETS>2.0.CO%3B2-L )

Figuring out how valueline arrive at the “timeliness” formula is something I and others have tried for a long time. It is a tightly held secret, but it is commonly believed to be related to earnings momentum and relative strength. While 14.5% may seem small fry to what people believe p123 is capable of, remember this is a very long track record, and has been achieved in real time, not in some simualted backtest with the benefit of hindsight.

Nevertheless, on backtest.org you can choose what range of “Timeliness” to select from. You must select 1-5 if you want to scan the entire market (effectively turning the feature off).

A little bit of further digging uncovoured this paper:

http://advancedportfoliosolutions.com/Waggle_Agrrawal_Johnson.pdf

He effectively attempts to reverse engineer the value line ratings:

Then of course, something acedemics rarely concede:

Ultimately, I think it is all very impressive. The guys in running valueline 1965 managed to put together a quantititive stock selection system that has been working for over 40 years, and that was a time when computers filled rooms and ran on punch cards!

I find it very interesting the comments about the lack of correlation to “value”, because acedemics concede value effects, and the fact that “timeliness” represents a factor that is not based on “value” makes it all the more interesting.

Hopfeully, if this paper (and others) are correct in their attempts to reverse engineer the rankings, it can confirm something many of us on p123 believe- namely that stock price momentum is good, as is earnings momentum.

Oliver:

Thanks for the link to that Motley Fool’s message describing the screens. Very helpful introduction to some of the main screens. The Excel sheet referred to in my post lists many more screens, but the descriptions are harder to understand. Each helps me understand the other, so I’ve got a better handle on things now.

I agree that backtester.org is not as flexible as P123, but I do think one can do some basic multi-dimensional ranking using the SS (“Screen of Screens”) feature. Here is the URL and a brief description of SS: Screen of Screens Backtest

By default this Screen of Screens multi-factor ranking appears to give equal weight to each screen. However, “doubling up” or even “tripling up” for one factor can be one by selecting it more than once. Here is screen snap to illustrate;
Opps, I first uploaded the picture as an MS “Snip” file. There is no way to delete it, but I have uploaded the same thing in “jpeg” format.


multi factor ranking with backtest_org.snip (62.7 KB)


Oliver:

Interesting. Perhaps for future study. His interpretation of the “timeliness” factor places an emphasis on earnings growth, which generally reminds me of AAII’s Zweig screen. That Zweig screen as a remarkable compounded gain over 35% since 1998 when AAII began forward testing (although it has been underperforming since I stated using it a couple years ago).

My current interest in valueline’s timeliness ranking was to find a way to neutralize its when using backtest.org’s built in screens. Your idea of setting the timeliness range to 1-5 (ie, all ranks) would in custom screens. However, I can not use that trick within the canned backtest.org screens. So it looks if I will have to learn the ins and outs of their rather cryptic codes used in its scripting language. The language appears to be relatively powerful language since it allows multiple screens, tie breakers, etc.

Although it can not does several things one can do in P123, it does appear it can do a few things that are not yet in P123. For example, it’s trading tester can be set to withdraw cash each month, thus simulating a post retirement trading account. I will not have need of that for several years so I expect P123 will have it by then.

Brian

In the 90’s, many hedge funds reverse engineered the Value Line ranking system and then they would game it. Namely, they would buy stocks their model said would become Value Line Timeliness 1’s stocks before the publication reached consumers and then sell on the minor expected pop. The street gossip was that earnings surprise was the most important element in their ranking system.

AAII.com has been forward testing a bunch of strategies since the beginning of 1998. You can download the monthly performace of these in the form of an excel spreadsheet for free. You have to sign up to get the details of the criteria for the screens, but just from the titles you can get a general idea of waht they are all about.

Charles:

Good point. The AAII strategy that is similar to most public strategies on P123 is Tiny Titans which combines value and price momentum with a focus on smaller cap stocks. It is instructive to see how Tiny Titans weathered the market crash of 1998. Some of the other AAII strategies are also suggestive of strategies that could be developed in P123.

backtest.org has an additional 12 years of data which lets one see how a strategy would do during a “regular” recession (1990-92) which is different than the bubble/bust of 1999-2002.

The challenge with backtest.org is their use of one or two proprietary ValueLine factors in most of their canned strategies. I plan to stay with P123 so I prefer to be able to test standard strategies in backtest.org since these would be similar to what we can do with P123.

However, I am finding it a considerable challenge to figure out the cryptic filter and sorting codes used to build custom strategies in backtest.org

Brian

If you give me an example of a strategy you would like to build and test I could show you how to construct it…

Oliver, thank you for the kind offer.

I may be trying to do something that is not possible in backtest.org (even though the documentation seems to state it is possible to do it.) What I am trying to do is get the SS (Screen of Screens) tester to run using my custom coded screens.

I can get the SS tester to run using their built in screens. I can even write the cryptic scripting code in URL format and have the SS tester automatically set itself up as specified in the URL formated codes (I give an example in more detail below).

Also I can get the SB (Screen Builder) tester to accept my custom written URLs. And the SB tester will run the test properly.

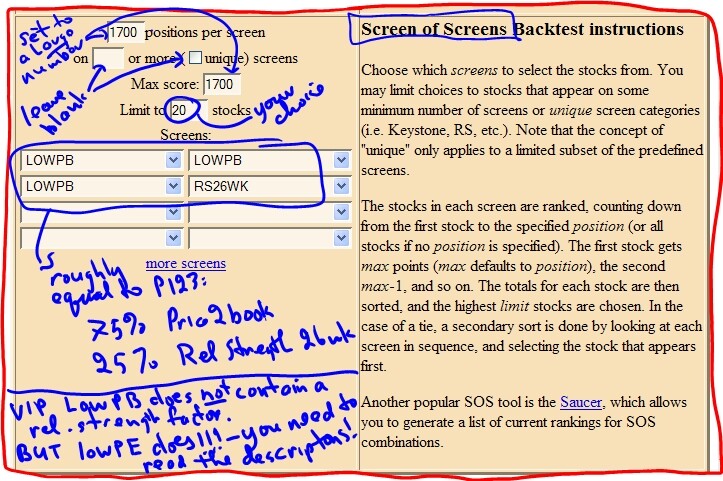
What I can not seem to get to work is to get the SS (Screen of Screens) tester to accept my custom built screens. I want to use the SS tester because it does MULTI-DIMENSIONAL RANKING in a very similar way to how Portfolio123 does. Although backtest.org does not use the term ranking in SS, the documentation says it numbers the position of each stock in each of the various “screens” specified and then totals the numbers before selecting the top stocks for rebalancing. That sounds very much like what Portfolio123 does. It should be noted that P123 is much more flexible since one can give different weights to various factors, but in backttest.org each “screen” (ie ranking factor) is given equal weight. But a workaround is to include a “screen” more than once in the list of screens and thus give it greater weight!!!

I am beginning to wonder if the SS (Screen of Screens) tester only works with built in screens – even though the set up page says one can substitute custom code for the built in code.

Do you know if I am trying to do something that is not possible in backtest.org?


OK, the above is the “executive summary” of the situation. Below explains it in more detail.

I am able to write the cryptic scripting URL that works for a single screen: For example I can write the following and it works:

http://www.backtest.org/9806SBprsrL1Xr26T20

This URL takes one to backtest.org which correctly decodes the 9806SBprsrL1Xr26T20 and sets the tester up to run for the dates 1998 to 2006 using SB (Screen Builder) with 2 screening rules: first “prsrL1” which means p2sales < 1 and those passing that screen are sorted by “r26” (26 week greatest total return, basically price appreciation plus dividends) and the “l20” (lower case L + 20, puts the top 20 stocks into the test portfolio). And when I click on “Run” the back test works as it should.

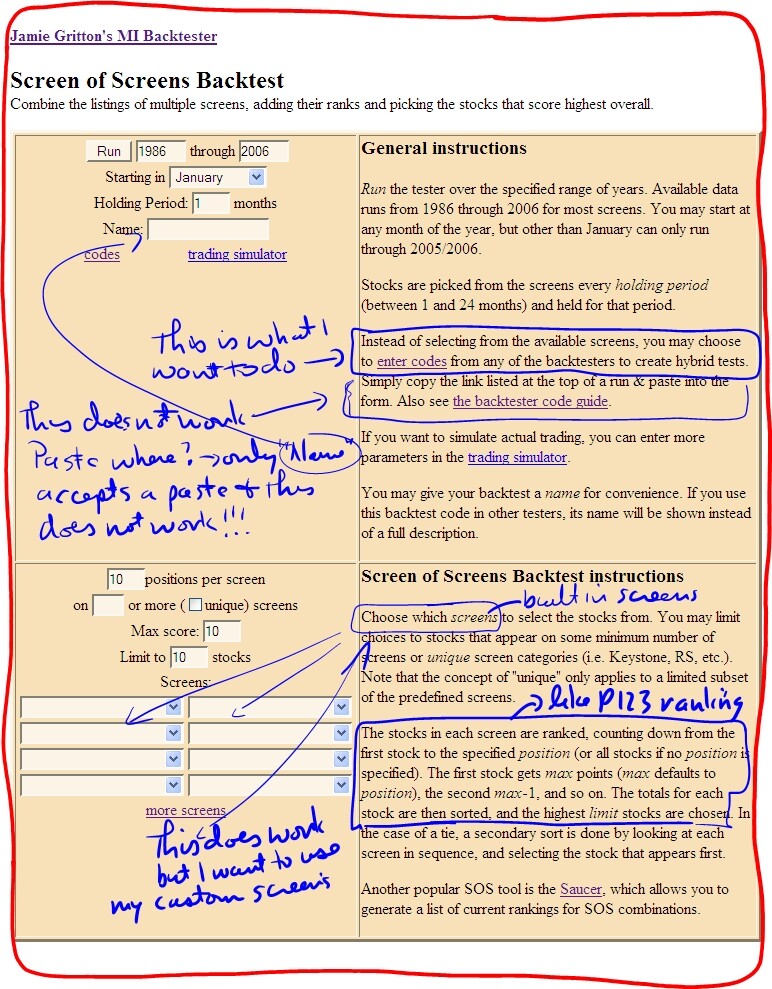
I will include a screen snap of the SS page. That page says a user can use “codes” instead of the built in screens. The page is not clear where one should paste in those codes, but there is only one field on the page that accepts pasting in, the “Name” field. And pasting the code into the Name field does not work.

Oh, I can get the SS tester to accept scripting coded into a URL if I am willing to just use the built in screens to do my ranking. For example,

http://www.backtest.org/SSpsrs999l20

This will open the SS tester and set up two ranking screens. The “ps” is the built in “PEG” screen (don’t ask my why they choose to use “ps” which sounds like price2sales to instead stand for “PEG”). The “rs” is the built in 26 week Return screen (I guess the “s” stands for semi-annual). The tester automatically selects ps and rs on two of the pull down boxes. It is all ready to go and it runs the test properly. I can place additional codes for other built in screens into the URL and this URL works properly when clicked on: the additional screens get added to the pull down screen boxes.

OK, back to the problem of trying to get the SS tester to accept my CUSTOM coded screens in place of those built in screens.

Here is the scripting code I want to run. This is a rather simple 3 screen code, but if I can get this simple one to work, I can easily build more complex ones.

SSOcpeCOr26COr13C9999l20

Here is the parsing of the above code using the rules specified on pages 3 and 4 of Backtest Codes.

SS invokes the Screen of Screen tester
OcpeC rank stocks by current p/e, remember the O and C stand for ( and ) parenthesis
This assumes one can use (cpe) type codes in place of the ss 2 char built in screens
Or26C rank stocks by 26 week total Return (I assume that is price + dividends)
Or13C rank stocks by 13 week total Return
9999 a nice high number just to be sure all stocks get ranked.
l20 sets the number of stocks in the portfolio to a maximum of 20.

And finally here is the pseudo English code (what I am trying to do in this simple model):
Invoke the SS tester,
1stScreen(rank by current p/e),
2ndScreen(rank by 26 week price appreciation),
3rdScreen(rank by 13 week price appreciation),
include all stocks in ranking by setting maximum stocks as 9999, select the top 20 stocks.

After spending a lot of time on this, I am beginning to wonder if the SS (Screen of Screens) tester only works with built in screens – even though the set up page says one can substitute custom code for the built in code.

Or is there a way to get SS (Screen of Screens) to accept custom screen definitions?

Thanks for listening.

Brian (o086)


I really like Portfolio123. After working a bit with backtest.org, it gives me a fresh appreciations for P123’s flexibility and ease of use. Once P123 gets a longer history, I will be glad to not have to wrestle with backtest.org’s cryptic scripting code. And to try to read between the lines of its documentation to figure out key instructions that are left unspecified.

On the other hand, I am quite glad to have access to the 20+ years of data from backtest.org while we await P123’s data extension.

Brian (o806)

I believe somthing like this might be what you are looking for:

http://www.backtest.org/SSrsrq(LOWPE)1500m1000l20

That uses a lot of the “standard screens”, but most of the elementry screens (P/E, RS etc.) are in there…

I think, if you want to enter custom screens you can go to:

http://www.backtest.org/n3uSSrsrq(LOWPE)1500m1000l20


Remember, the website is non-commercial set up by a bunch of enthusiasts!