Have your ports been underperforming? I think I may know why...

I have been noticing some ports haven’t been performing that well in 2007, and I have been wondering why, but I think I have figured it out.

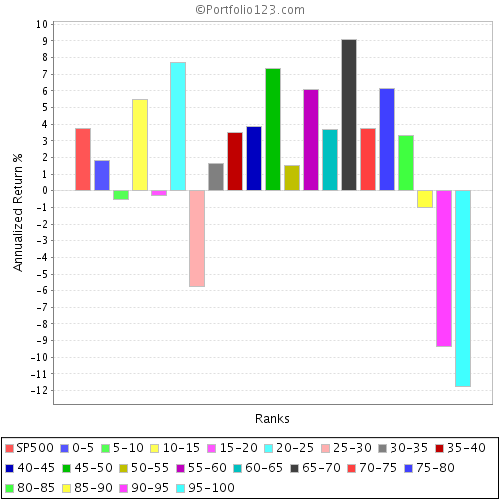
One of the most powerful factors has been Price-to-sales-quarterly in backtesting. But looking at the 2007 performance, the top decline has given negative performance. I attatch a graph showing this, four week rebalance with a minimum liquidity pre-screen: >$50m mktcap, >$200k daily turn, >$3 price.

I did wonder if this was the death of value.

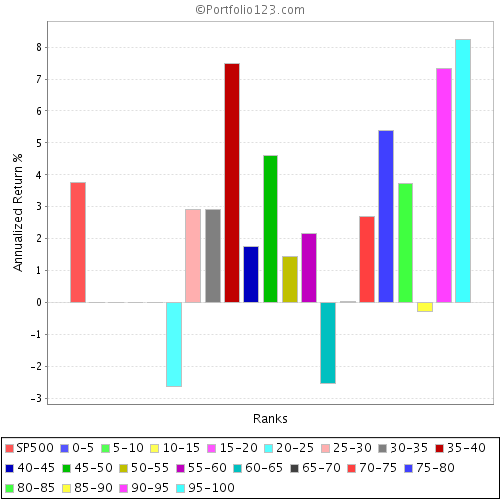
Interestingly, the same effect has not been true with Price-to-cashflow.

I just wonder if there has been something of a “bubble” in the low price-to-sales shares. As their performance has been good, people like us have piled into them driving up the price etc. etc. However, they have low ratios for a reason: Poor profit margins. Investors cannot “eat” sales, only what can be produced from them.

Perhaps the reason price-to-cashflow has not had the same problem is that investors can “eat” cashflow. Perhaps one should consider tweaking systems to favour cashflow measures over sales. On the other hand, I am always rather loathed to change trading systems based on recent performance, if you keep fiddling with the system then you can never expect to get good performance over the long run. Any thoughts?


price2salesq2007.png


pr2cashflQ2007.png

I will check on another system. I think another reason for the underperformance in models is they are statistically overbought. Quant friend with a very good track record running institutional money told me a couple of weeks ago they were finding that top performng stocks in the top decile of their models had out performed the bottom decile by the widest margin since march 2000 indicating a reversion to the mean trade. They were a little early but it appears to be panning out. I wrote an article on the effect on minyanville.com.

Look under community and professors.

David Nelson. Bottom of bio is link to articles.

Blending screens employing different factor systems is key. Granted, P123 has only 7 years of historical data, but I have backtested some of my models over larger periods of time and seen the factor sets I use going in and out of favor, then back in favor again. If we ask Fama French they will tell us the best factor over the last 50 years was small capitalization. Is that always the case breaking the test period in 5-years samples?

We could compare factor models allocations to asset allocation. How to forecast best returns for Commodities, REIT, Emergin, Bonds and Stocks for the next year? Some research papers point out that a simple relative strength system (say, hold the best 3 classes over the last 6 months) reduces risk. Or isn’t a better strategy to simply diversify holding different asset classes all the time? Some other research point out that the worst performing classes for the last 2 years have the strongest mean reversion returns the next year.
What I mean is that asset allocation is a difficult enough job when it comes to macro factors. For stock models, I would stick with the same blend of low-correlated systems.

Exactly the reaosn for my third attempt at a major ranking system, based on multifactors ( http://www.portfolio123.com/mvnforum/viewthread?thread=2837 )

One issue is that the backtested performance isn’t as lucrative, as if you have just one factor or two you can find out what worked best in the past. Not necessarily going forward.

Of course, some ranking systems look to be multifactor on the surface, but in reality are just diffferent flavours of the same thing, like ROE ROI ROA etc. You want some diversify with truely uncorrelated factors. Perhaps why momentum and value has worked so well.

David:

You wrote: “I wrote an article on the effect on minyanville.com

Which article?

Glenn

I believe this might be the article he was referring to:

http://www.minyanville.com/articles/DRYS-RIO-MT-MBT-FCX/index/a/14216

Holding the highest ranked stocks based on a larger set of factors is not equivalent to having the same number of stocks selected from different models. I personally prefer to develop several models focused on specific inefficiencies and then blend the top picks.

I understand that approach, and I think it has some merit. However, it isn’t very conservative.

What I have noticed is that it is the top buckets of p/sales that has performed badly, specifically the top bucket.

The risk is that if you backtest and simply tune to maximise annualised returns, then it is likely others have adopted the same trade. The issue then becomes that in the future, the best returns come from a space that is outside the space others are operating in, i.e. “sub-optimal” space.

I have noticed, that recently larger stock portfolios based on the same ranking system have been outperforming smaller ones. Take a look, this is the 40 stock port version of my Momentum Value system:

http://www.portfolio123.com/port_summary.jsp?portid=324353

Not great.

But look at the 100 stock version:

http://www.portfolio123.com/port_summary.jsp?portid=321100

Better returns. A 200 stock version gives similar results:

http://www.portfolio123.com/port_summary.jsp?portid=320247

Essentially, what has happened is that stocks that are further down the ranking have outperformed those at the very top, especially as stocks with a low price/sales ratio have recently underperformed.

Effectively, the “sweet spot” in the ranking system has changed. This makes me think there is something to be said for large stock portfolios, with stocks across a range of different ranks, less sensitive to fluctuations in what comes in and out of favour.

If you had bet on price-to-sales you would have been burned on that portfolio this year…

Its always the problem, investing with the benefit of hindsight is easy, doing it in real time is more of a challenge :slight_smile:

Oliver:

You wrote: “I have been noticing some ports haven’t been performing that well in 2007, and I have been wondering why, but I think I have figured it out.”

I have been wondering about recent performance as well. I am not sure Pr2SalesQ explains it.

I used Dan’s Top Factors 12-05 Excellent Only Optimized which has Pr2SalesQ, Prc2SalesIncDebt -Universe and Prc2SalesIncDebt - Industry as factors. It is also generally regarded as a good ranking system and a lot of sims and ports have used it.

Performance has fallen off recently as you can see on the atttached Excel file with screen prints. Look at the performance graphs at the bottom. The top 10 buckets are 37 to 78 for 11/04 to 5/06. The graph for 1/07 to 11/07 are much lower - 12 to 38. What happened?

Next, I looked at the reverse engineer tables for the same periods. They are at the top of the spreadsheet with the same periods. I do not see any really big differences in the Avg Rank for the Pr2Sales factors. If you are right shouldn’t there be a big change in the Avg Rank?

I even changed the Pr2SalesQ weight to 0 and gave the 9% to the highest Avg Rank and looked at the graph; no appreciable change.

Maybe Dan Parquette has some insights. Maybe we need Dan’s Top Factors 12/07.

I do not see that one factor is the reason for the lower performance of the older rankings. I did the same for P123’s Balanced4. Same results. Something has changed but I cannot see what it is.

Glenn

PS The periods were chosen carefully. 11/04 to 5/06 covers 12/05 and giave me the 20 sample max on the reverse engineer screen. 1/07 to 11/07 is simply this year. I fooled around with different periods a bit but there was no difference in the results that i could see.


Dans TF Compare.xls (439 KB)

olikea:

Good point about some factors being very similar.

I think there are a couple logical reasons why price momentum and value are a much more powerful a pair together than either is when used independently. In fact, I think all value rankings need to be “confirmed” by positive price momentum

Value factors without price momentum will always “lag” reality by several weeks. For example, if a company’s sales start declining today, it will take at least several weeks if not a few months before this change gets reflected in the p2sales factor calculated from the quarterly SEC filings. Since the market often “knows” about declining sales long before it gets reported in the next SEC filing (perhaps market gets wind because a competitor has just filed its SEC report showing reduced sales, or some insider news gets leaked, or the CFO quits, etc.), the price of the stock goes down. But until the stock files its own SEC report or makes a preannouncement that gets recorded by Reuters for P123, there will be several weeks when the sales number is high (based on the sales report of the last SEC filing) in comparison to a recently lowered price. Such poor stocks might go to the top of the p2sales ranking.

However, this problem is (largely) removed by including a price momentum factor. Good price momentum is confirmation that the p2sales factor is still credible. Price momentum has the same benefit for other value factors like p2cashflow, p2earnings, p2book, etc. momentum. If a stocks"bad" stock has an unrealistic p2sales number, the market will signal this by depressing its price.

Including a price momentum factor has a second benefit. Sometimes good value stocks can languish for months until they get noticed by the market. Positive price momentum is an indication that a value stock’s time in the sun has arrived. One of the nicest explanations of this role for price momentum is given by Towns in Rule #1.

So price momentum helps value ranking systems by identifying when a good value stock is most likely to increase in price and by weeding out bad value stocks with untrustworthy fundamental figures.

Brian (o806)

PS: Short Interest might do an equally good job as price momentum for weeding out stocks with unreliable high value rankings if it were reported on a timely basis. Currently reporting of short interest lags by 2 to 4 weeks or more, so SI%ShsOut can serve as an additional warning factor, but it can not replace attention to price action.

Olikea,

I have to agree with Proptrader. The problem is your Ranking System, not the highest ranked stocks Vs lower ranked stocks. See the 4 Sims below that I set up to look at only ½ % rank ranges. I ran them using your Sim with the same start/stop dates and the following changes:

  1. I changed the Ranking System to the P123 Momentum Value system which uses many more factors.

  2. I added Rank range limits in the Buy and Sell Rules such that the Sim would only buy stocks in each Range and sell them if they moved out of the range.

  3. I changed them to 10 stock Sims so that they would buy the highest 10 stocks that pass your other buy rules in each rank range.

This Sim only buys stocks with a Rank = 99.5 to 100
It has an annual gain of 57% with a 12% drawdown.

http://www.portfolio123.com/port_summary.jsp?portid=324363

This Sim only buys stocks with a Rank = 99 to 99.5
It has an annual gain of 16.5% with a 17.8% drawdown.

http://www.portfolio123.com/port_summary.jsp?portid=324441

This Sim only buys stocks with a Rank = 98.5 to 99
It has an annual gain of 9.87% with a 19.9% drawdown.

http://www.portfolio123.com/port_summary.jsp?portid=324372

This Sim only buys stocks with a Rank = 98 to 98.5
It has an annual gain of 13.7% with a 16.5% drawdown.

http://www.portfolio123.com/port_summary.jsp?portid=324443

So, with the right ranking system the highest ranked stocks still have the highest gains.

Denny :sunglasses:

An article by Loren Cobb on extremely ranked stocks.

Why does screening work, when sophisticated regression methods fail? I believe that it works because the price of a stock that is extreme in certain important respects will behave differently from the multitudes of ordinary stocks.

http://www.aetheling.com/MI/Screening.html

Denny, it is an interesting sim you posted, I am not sure what to make of it, it has me confused.

The “stock” p123 systems based on momentum value have not outperformed this year (e.g. http://www.portfolio123.com/port_summary.jsp?portid=171692)

Also, see my attatched image of the ranking buckets for momentum value YTD and the TF12 system YTD. Again, four week rebalance with my minimum liquidity prescreen. Notice how the top half percentile bucket has underperformed relative to the next few buckets down in each case…

***Made a small mistake, the first “TF12” graph actually is my third gen ranking system YTD


After thinking a lot of the comments about extreme rankings, screenings etc. I must admit I am not sure I really “get” it.

Perhaps I need an improved education in this area - can anyone recommend any books? Or even someone could explain to me… for example:

I just don’t understand… how does that indicate reversion to the mean?

This is interesting, but how do you actually measure this? The word “statisctically” implies there is some explicit method…

[quote]
(probtrader)An article by Loren Cobb on extremely ranked stocks.
Why does screening work, when sophisticated regression methods fail? I believe that it works because the price of a stock that is extreme in certain important respects will behave differently from the multitudes of ordinary stocks.
[/quote]Precisely. One lesson is that – contrary to the P123 general consensus – returns in anything but the highest buckets are NOT important in evaluating a ranking system.

Two immediate thoughts come to mind:
(1) It may be possible to improve on Dan Parquette’s TopFactor systems by giving less weight to factors that were included because of the “smooth decline” criteria in his spreadsheet.
(2) Ranking System performance charts could be made more helpful by concentrating on the extremes.

The second point underlies two CY2005 feature requests:
(a) Allow drilling down into buckets. Tweaking Marco: “This enhancement is planned in the near future.” (April 2005)
(b) Allow unequally-sized buckets

Olikea,

In response to your last post responding to my last post:

“Also, see my attached image of the ranking buckets for momentum value YTD and the TF12 system YTD. Again, four week rebalance with my minimum liquidity prescreen. Notice how the top half percentile bucket has underperformed relative to the next few buckets down in each case…”

If you check the Transactions; All page of the “stock” P123 Momentum Value Port you posted you will see that since Jan 1 2007 the Port has bought 38 stocks. Of those, only 9 had a rank value in the top bucket > 99.5, and the Port bought stocks with a rank value as low as 96.6. Because the buy rules are fairly restrictive the Port reaches down in the rank values to find stocks that meet the buy rules. This is one reason I ALWAYS use a Rank > xx buy rule.

OK, let me confuse you some more. I set up a Ranking System Performance to simulate, as closely as possible, the Sims I ran above. I ran the performance on the P123 Momentum Value starting 12/30/06 using the following Screen to more accuracy simulate your Sims buy rules; AvgDailyTot(20) > 200000 & MktCap > 25 & Close(0) > 1. Since the average days held for all the stocks in my first Sim above (the Rank > 99.5 Sim) was a little less than 60 days, I used a rebalance frequency of 8 weeks. I think that this is about the best way that we can run the Ranking System Performance to simulate the Sim. Run with these settings the top bucket has the highest return. Interesting. See Below:

Denny :sunglasses:

Settings:
Start Date: 12/30/06
End Date: 11/10/07
Rebalance Frequency: Eight Weeks
Universe: All Stocks
Screen: $200K & $1 & 25Mil Cap
NA’s in Incomplete Statements: From Previous Quarter
Filters:
Number of Buckets: 200
Minimum Price: 1.0
Sector: ALL


MomValue Perf.png